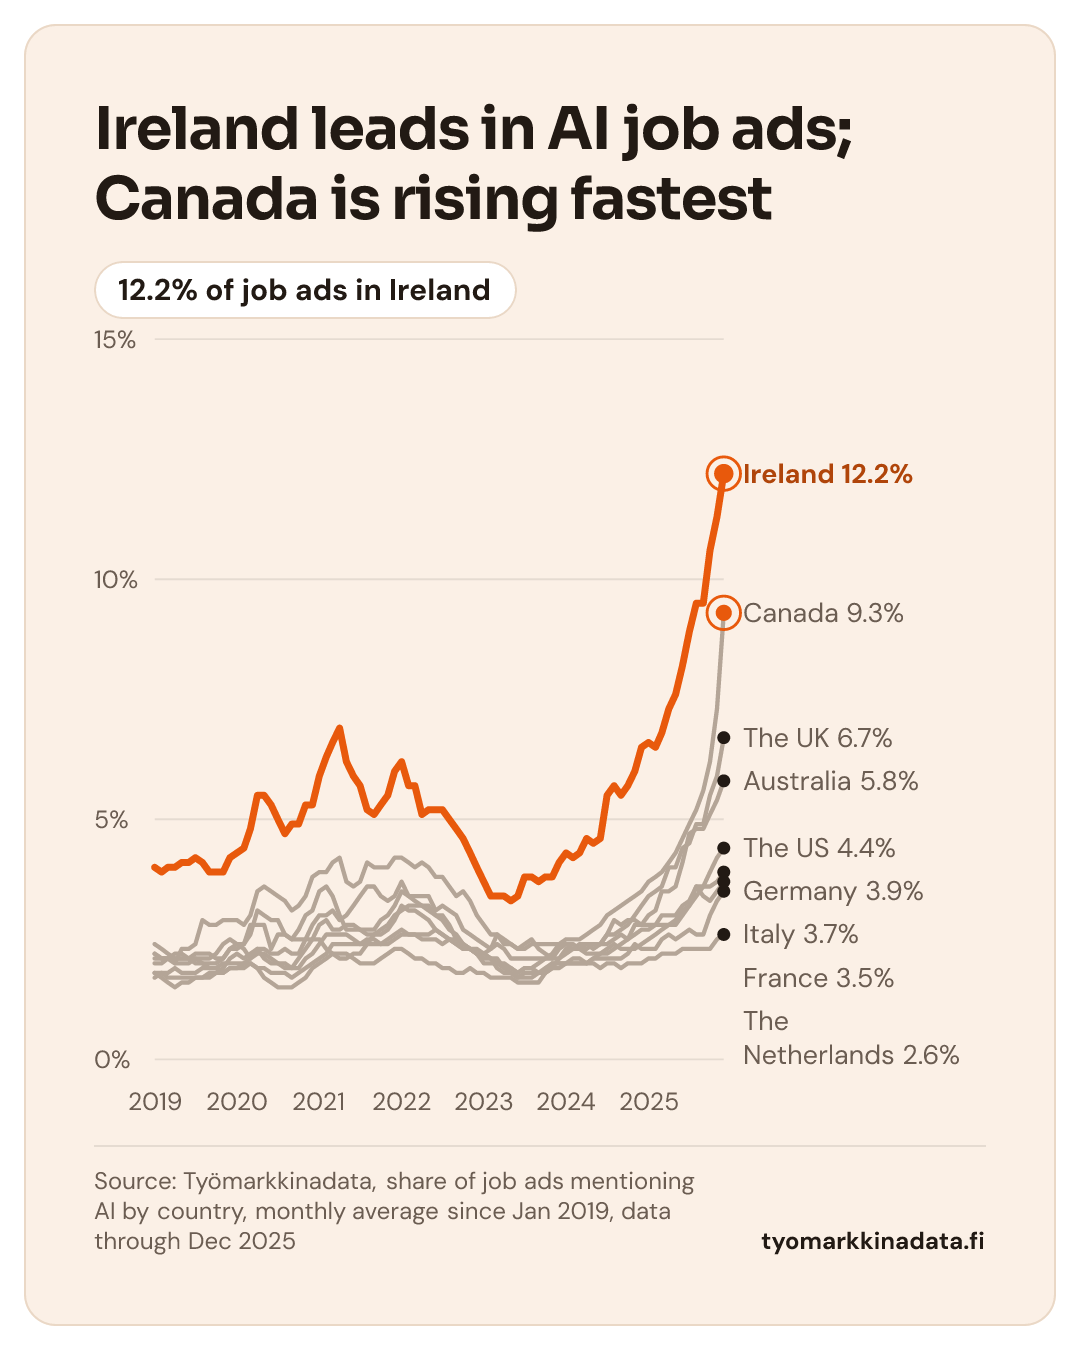
Ireland leads in AI job ads; Canada is rising fastest
12.2% of job ads in Ireland
| Date | Ireland | Canada | The UK | Australia | The US | Germany | Italy | France | The Netherlands |
|---|---|---|---|---|---|---|---|---|---|
| 2019-01-01 | 4% | 1.8% | 2.1% | 2.2% | 1.7% | 2% | 2.2% | 2.4% | 1.8% |
| 2019-02-01 | 3.9% | 1.7% | 2.1% | 2.1% | 1.8% | 2% | 2.1% | 2.3% | 1.8% |
| 2019-03-01 | 4% | 1.6% | 2.1% | 2.1% | 1.7% | 2.1% | 2.1% | 2.2% | 1.8% |
| 2019-04-01 | 4% | 1.5% | 2% | 2.2% | 1.7% | 2.1% | 2% | 2.1% | 1.9% |
| 2019-05-01 | 4.1% | 1.6% | 2% | 2.2% | 1.7% | 2.1% | 2.3% | 2.1% | 1.8% |
| 2019-06-01 | 4.1% | 1.6% | 2% | 2.1% | 1.7% | 2.1% | 2.3% | 2.1% | 1.8% |
| 2019-07-01 | 4.2% | 1.7% | 2.1% | 2.2% | 1.7% | 2% | 2.4% | 2.1% | 1.8% |
| 2019-08-01 | 4.1% | 1.7% | 2% | 2.2% | 1.7% | 2% | 2.9% | 2.1% | 1.9% |
| 2019-09-01 | 3.9% | 1.7% | 2% | 2.2% | 1.8% | 1.9% | 2.8% | 2.1% | 1.9% |
| 2019-10-01 | 3.9% | 1.8% | 2% | 2.1% | 1.8% | 1.9% | 2.8% | 2.2% | 1.9% |
| 2019-11-01 | 3.9% | 1.9% | 2.1% | 2.1% | 1.8% | 2% | 2.9% | 2.4% | 1.8% |
| 2019-12-01 | 4.2% | 2.1% | 2.3% | 2.3% | 1.9% | 2% | 2.9% | 2.5% | 1.9% |
| 2020-01-01 | 4.3% | 2.2% | 2.3% | 2.4% | 1.9% | 2% | 2.9% | 2.4% | 1.9% |
| 2020-02-01 | 4.4% | 2.1% | 2.4% | 2.4% | 1.9% | 2% | 2.8% | 2.3% | 2% |
| 2020-03-01 | 4.8% | 2.2% | 2.6% | 2.8% | 2% | 2% | 3% | 2.1% | 2.1% |
| 2020-04-01 | 5.5% | 2.3% | 3.1% | 2.8% | 1.9% | 1.9% | 3.5% | 2.3% | 2.2% |
| 2020-05-01 | 5.5% | 2.1% | 3% | 2.8% | 1.7% | 1.9% | 3.6% | 2.3% | 2.2% |
| 2020-06-01 | 5.3% | 2% | 2.9% | 2.3% | 1.6% | 1.8% | 3.5% | 2.2% | 2.1% |
| 2020-07-01 | 5% | 2% | 2.9% | 2.6% | 1.5% | 1.8% | 3.4% | 2.2% | 2% |
| 2020-08-01 | 4.7% | 1.9% | 2.6% | 2.6% | 1.5% | 1.8% | 3.3% | 2.3% | 2% |
| 2020-09-01 | 4.9% | 1.9% | 2.5% | 2.5% | 1.5% | 1.7% | 3.1% | 2.2% | 1.9% |
| 2020-10-01 | 4.9% | 2.1% | 2.7% | 2.5% | 1.6% | 1.8% | 3.2% | 2.2% | 1.9% |
| 2020-11-01 | 5.3% | 2.3% | 3% | 2.5% | 1.7% | 1.9% | 3.4% | 2.5% | 2.1% |
| 2020-12-01 | 5.3% | 2.5% | 3.1% | 2.8% | 1.9% | 2% | 3.8% | 2.5% | 2.2% |
| 2021-01-01 | 5.9% | 2.8% | 3.5% | 3% | 2% | 2.1% | 3.9% | 2.5% | 2.4% |
| 2021-02-01 | 6.3% | 2.9% | 3.6% | 3% | 2.1% | 2.2% | 3.9% | 2.3% | 2.6% |
| 2021-03-01 | 6.6% | 2.7% | 3.4% | 3.1% | 2.2% | 2.4% | 4.1% | 2.2% | 2.6% |
| 2021-04-01 | 6.9% | 2.7% | 3% | 2.9% | 2.1% | 2.4% | 4.2% | 2.2% | 2.6% |
| 2021-05-01 | 6.2% | 2.8% | 2.7% | 3% | 2.1% | 2.4% | 3.7% | 2.2% | 2.6% |
| 2021-06-01 | 5.9% | 2.8% | 2.7% | 3.2% | 2.2% | 2.4% | 3.6% | 2.1% | 2.5% |
| 2021-07-01 | 5.7% | 2.7% | 2.7% | 3.4% | 2.2% | 2.4% | 3.7% | 2% | 2.4% |
| 2021-08-01 | 5.2% | 2.7% | 2.6% | 3.6% | 2.4% | 2.5% | 4.1% | 2% | 2.4% |
| 2021-09-01 | 5.1% | 2.7% | 2.6% | 3.6% | 2.6% | 2.5% | 4% | 2% | 2.4% |
| 2021-10-01 | 5.3% | 2.9% | 2.6% | 3.4% | 2.7% | 2.4% | 4% | 2.1% | 2.4% |
| 2021-11-01 | 5.5% | 3% | 2.7% | 3.3% | 2.8% | 2.4% | 4% | 2.2% | 2.5% |
| 2021-12-01 | 6% | 3.2% | 2.9% | 3.4% | 3% | 2.5% | 4.2% | 2.3% | 2.6% |
| 2022-01-01 | 6.2% | 3.5% | 3.2% | 3.7% | 3.1% | 2.6% | 4.2% | 2.3% | 2.7% |
| 2022-02-01 | 5.7% | 3.4% | 3.1% | 3.4% | 3.2% | 2.6% | 4.1% | 2.2% | 2.6% |
| 2022-03-01 | 5.7% | 3.3% | 3.1% | 3.4% | 3.2% | 2.6% | 4% | 2.1% | 2.6% |
| 2022-04-01 | 5.1% | 3.2% | 3% | 3.4% | 3.2% | 2.6% | 4.1% | 2.1% | 2.5% |
| 2022-05-01 | 5.2% | 3.1% | 2.9% | 3.4% | 3.2% | 2.6% | 4% | 2% | 2.5% |
| 2022-06-01 | 5.2% | 3% | 2.7% | 3.1% | 3% | 2.7% | 3.8% | 2% | 2.5% |
| 2022-07-01 | 5.2% | 3% | 2.6% | 3.2% | 2.9% | 2.6% | 3.8% | 1.9% | 2.4% |
| 2022-08-01 | 5% | 2.8% | 2.5% | 3.1% | 2.7% | 2.5% | 3.6% | 1.9% | 2.5% |
| 2022-09-01 | 4.8% | 2.5% | 2.4% | 3% | 2.6% | 2.5% | 3.4% | 1.8% | 2.4% |
| 2022-10-01 | 4.6% | 2.4% | 2.3% | 2.7% | 2.4% | 2.4% | 3.5% | 1.8% | 2.3% |
| 2022-11-01 | 4.3% | 2.3% | 2.3% | 2.6% | 2.3% | 2.3% | 3.3% | 1.9% | 2.3% |
| 2022-12-01 | 4% | 2.2% | 2.2% | 2.5% | 2.2% | 2.3% | 3% | 1.8% | 2.2% |
| 2023-01-01 | 3.7% | 2.2% | 2% | 2.4% | 2.2% | 2.2% | 2.8% | 1.8% | 2.1% |
| 2023-02-01 | 3.4% | 2.1% | 2% | 2.3% | 2.1% | 2.3% | 2.6% | 1.7% | 2.1% |
| 2023-03-01 | 3.4% | 2.1% | 2% | 2.6% | 1.9% | 2.4% | 2.6% | 1.7% | 2% |
| 2023-04-01 | 3.4% | 1.9% | 1.9% | 2.5% | 1.8% | 2.3% | 2.4% | 1.7% | 2% |
| 2023-05-01 | 3.3% | 1.9% | 1.8% | 2.4% | 1.8% | 2.1% | 2.4% | 1.7% | 1.9% |
| 2023-06-01 | 3.4% | 1.8% | 1.7% | 2.3% | 1.7% | 2.1% | 2.3% | 1.6% | 1.8% |
| 2023-07-01 | 3.8% | 1.9% | 1.8% | 2.4% | 1.7% | 2.1% | 2.3% | 1.6% | 1.9% |
| 2023-08-01 | 3.8% | 1.9% | 1.8% | 2.5% | 1.7% | 2.1% | 2.4% | 1.6% | 1.9% |
| 2023-09-01 | 3.7% | 2% | 1.8% | 2.3% | 1.8% | 2.1% | 2.4% | 1.6% | 1.8% |
| 2023-10-01 | 3.8% | 2.1% | 1.8% | 2.2% | 1.8% | 2.1% | 2.4% | 1.8% | 1.9% |
| 2023-11-01 | 3.8% | 2.2% | 1.9% | 2.1% | 1.9% | 2.1% | 2.4% | 2% | 2% |
| 2023-12-01 | 4.1% | 2.4% | 2.1% | 2.3% | 1.9% | 2.1% | 2.4% | 2% | 2% |
| 2024-01-01 | 4.3% | 2.5% | 2.2% | 2.4% | 2% | 2.3% | 2.4% | 2% | 2% |
| 2024-02-01 | 4.2% | 2.5% | 2.3% | 2.3% | 2.1% | 2.3% | 2.4% | 2% | 2% |
| 2024-03-01 | 4.3% | 2.5% | 2.3% | 2.4% | 2.1% | 2.3% | 2.3% | 2% | 2% |
| 2024-04-01 | 4.6% | 2.6% | 2.3% | 2.4% | 2% | 2.2% | 2.4% | 2% | 2% |
| 2024-05-01 | 4.5% | 2.7% | 2.4% | 2.4% | 2.1% | 2.2% | 2.3% | 2.1% | 2% |
| 2024-06-01 | 4.6% | 2.8% | 2.4% | 2.4% | 2.2% | 2.2% | 2.4% | 2.1% | 1.9% |
| 2024-07-01 | 5.5% | 3% | 2.6% | 2.4% | 2.2% | 2.3% | 2.6% | 2.1% | 2% |
| 2024-08-01 | 5.7% | 3.1% | 2.6% | 2.5% | 2.3% | 2.4% | 2.9% | 2.1% | 2% |
| 2024-09-01 | 5.5% | 3.2% | 2.7% | 2.6% | 2.4% | 2.3% | 2.8% | 2.1% | 1.9% |
| 2024-10-01 | 5.7% | 3.3% | 2.8% | 2.5% | 2.5% | 2.3% | 2.9% | 2.2% | 2% |
| 2024-11-01 | 6% | 3.4% | 3% | 2.8% | 2.6% | 2.3% | 2.9% | 2.4% | 2% |
| 2024-12-01 | 6.5% | 3.5% | 3.2% | 2.8% | 2.7% | 2.4% | 2.8% | 2.3% | 2% |
| 2025-01-01 | 6.6% | 3.7% | 3.4% | 3% | 2.7% | 2.5% | 2.8% | 2.3% | 2.1% |
| 2025-02-01 | 6.5% | 3.8% | 3.5% | 3.1% | 2.8% | 2.6% | 2.8% | 2.3% | 2.1% |
| 2025-03-01 | 6.8% | 3.9% | 3.6% | 3.5% | 2.8% | 2.7% | 3% | 2.5% | 2.2% |
| 2025-04-01 | 7.3% | 4.1% | 4% | 3.5% | 2.8% | 2.8% | 3% | 2.6% | 2.2% |
| 2025-05-01 | 7.6% | 4.3% | 4% | 3.6% | 2.8% | 2.9% | 3% | 2.5% | 2.2% |
| 2025-06-01 | 8.2% | 4.6% | 4.4% | 4.1% | 3% | 3.1% | 3.2% | 2.6% | 2.3% |
| 2025-07-01 | 8.9% | 4.9% | 4.5% | 4.7% | 3.2% | 3.2% | 3.3% | 2.7% | 2.3% |
| 2025-08-01 | 9.5% | 5.2% | 4.9% | 4.8% | 3.4% | 3.6% | 3.6% | 2.6% | 2.3% |
| 2025-09-01 | 9.5% | 5.6% | 4.9% | 4.8% | 3.6% | 3.6% | 3.4% | 2.6% | 2.3% |
| 2025-10-01 | 10.6% | 6.2% | 5.5% | 5.1% | 3.9% | 3.6% | 3.3% | 3% | 2.3% |
| 2025-11-01 | 11.3% | 7.3% | 5.9% | 5.4% | 4.2% | 3.7% | 3.5% | 3.3% | 2.5% |
| 2025-12-01 | 12.2% | 9.3% | 6.7% | 5.8% | 4.4% | 3.9% | 3.7% | 3.5% | 2.6% |
Source: Työmarkkinadata, share of job ads mentioning AI by country, monthly average since Jan 2019, data through Dec 2025tyomarkkinadata.fi