Global job market pulse

The global job market, June 2026

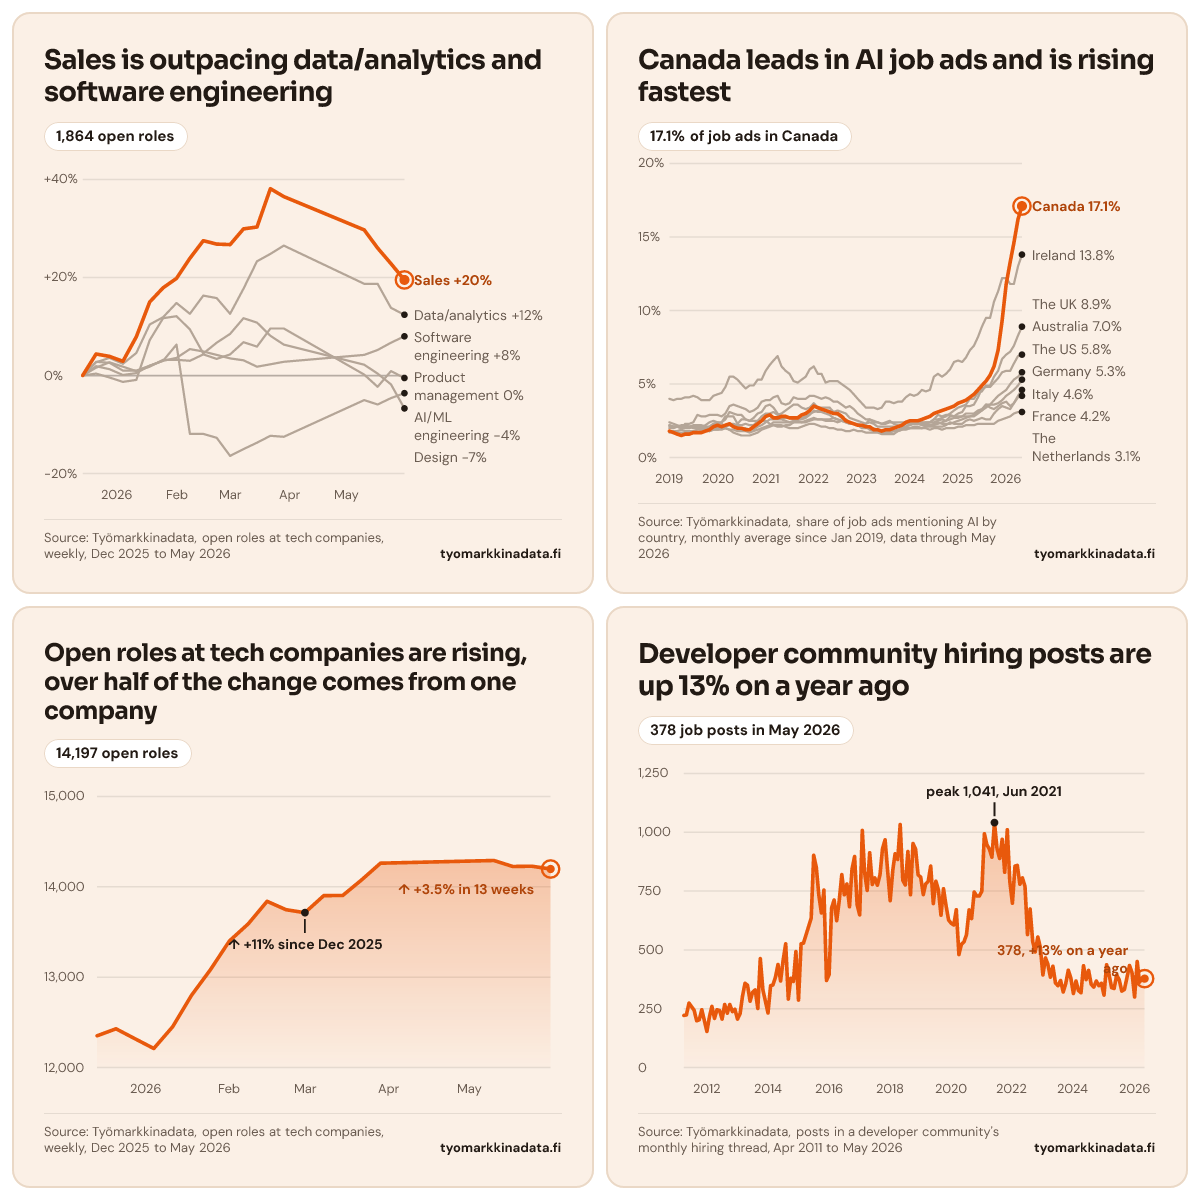
Once a month we put together four charts on how the job market is moving outside Finland: how much fast-growing companies are hiring and for which roles, how many job ads mention AI in different countries, and which skills international tech job ads ask for.

This month in charts

Every card can be downloaded as an image and shared.

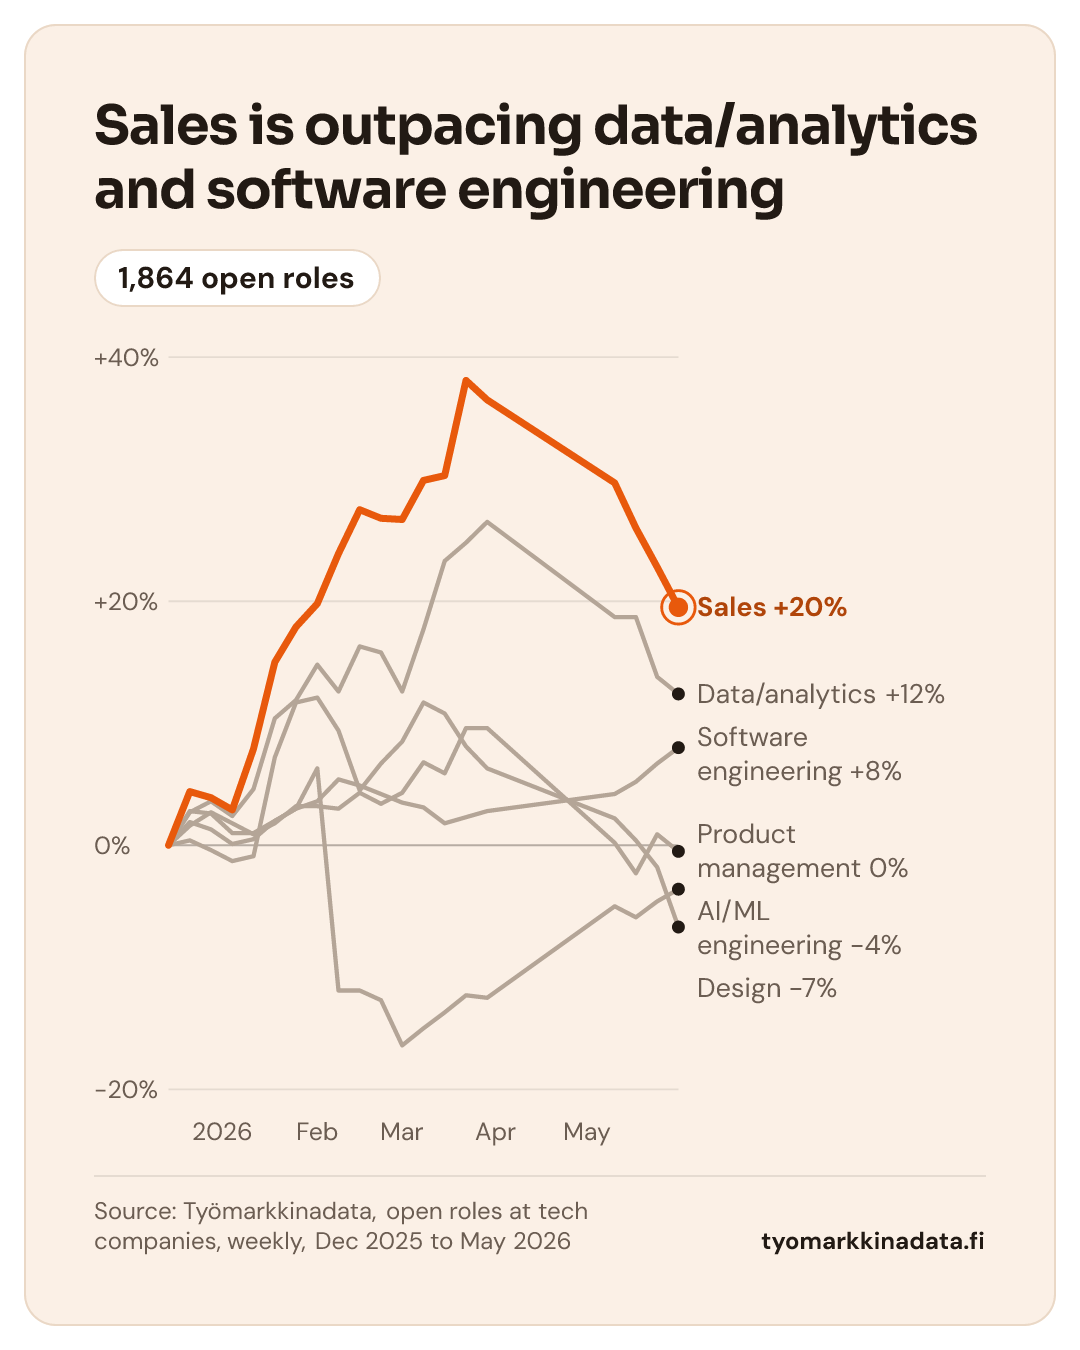
Sales is outpacing data/analytics and software engineering

1,864 open roles

Sales is outpacing data/analytics and software engineering: figures
DateSoftware engineeringAI/ML engineeringData/analyticsProduct managementDesignSales
2025-12-140%0%0%0%0%0%
2025-12-21+2%+3%+3%+2%0%+4%
2025-12-28+1%+3%+4%+3%0%+4%
2026-01-040%+1%+2%+2%-1%+3%
2026-01-11+1%+1%+5%+1%-1%+8%
2026-01-18+2%+2%+10%+2%+7%+15%
2026-01-25+3%+3%+12%+3%+12%+18%
2026-02-01+4%+6%+15%+3%+12%+20%
2026-02-08+5%-12%+13%+3%+9%+24%
2026-02-15+5%-12%+16%+4%+5%+28%
2026-02-22+4%-13%+16%+3%+7%+27%
2026-03-01+4%-16%+13%+4%+9%+27%
2026-03-08+3%-15%+18%+7%+12%+30%
2026-03-15+2%-14%+23%+6%+11%+30%
2026-03-22+2%-12%+25%+10%+8%+38%
2026-03-29+3%-12%+27%+10%+6%+37%
2026-05-10+4%-5%+19%0%+2%+30%
2026-05-17+5%-6%+19%-2%0%+26%
2026-05-24+7%-5%+14%+1%-2%+23%
2026-05-31+8%-4%+12%0%-7%+20%

Source: Työmarkkinadata, open roles at tech companies, weekly, Dec 2025 to May 2026tyomarkkinadata.fi

Download image: Sales is outpacing data/analytics and software engineering

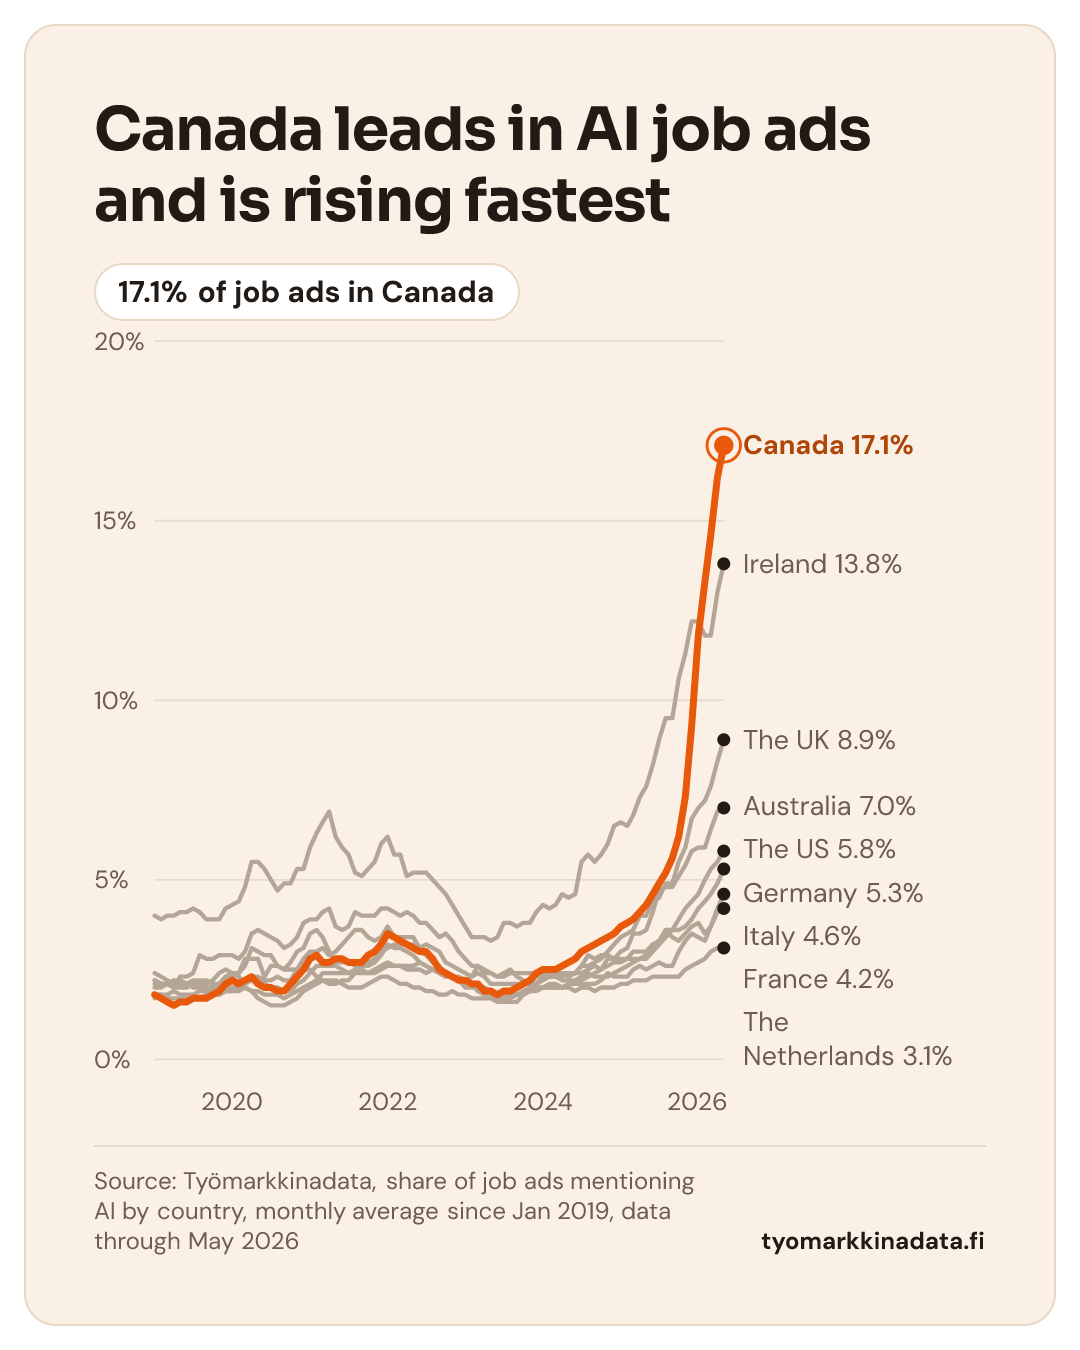
Canada leads in AI job ads and is rising fastest

17.1% of job ads in Canada

Canada leads in AI job ads and is rising fastest: figures
DateCanadaIrelandThe UKAustraliaThe USGermanyItalyFranceThe Netherlands
2019-01-011.8%4%2.1%2.2%1.7%2%2.2%2.4%1.8%
2019-02-011.7%3.9%2.1%2.1%1.8%2%2.1%2.3%1.8%
2019-03-011.6%4%2.1%2.1%1.7%2.1%2.1%2.2%1.8%
2019-04-011.5%4%2%2.2%1.7%2.1%2%2.1%1.9%
2019-05-011.6%4.1%2%2.2%1.7%2.1%2.3%2.1%1.8%
2019-06-011.6%4.1%2%2.1%1.7%2.1%2.3%2.1%1.8%
2019-07-011.7%4.2%2.1%2.2%1.7%2%2.4%2.1%1.8%
2019-08-011.7%4.1%2%2.2%1.7%2%2.9%2.1%1.9%
2019-09-011.7%3.9%2%2.2%1.8%1.9%2.8%2.1%1.9%
2019-10-011.8%3.9%2%2.1%1.8%1.9%2.8%2.2%1.9%
2019-11-011.9%3.9%2.1%2.1%1.8%2%2.9%2.4%1.8%
2019-12-012.1%4.2%2.3%2.3%1.9%2%2.9%2.5%1.9%
2020-01-012.2%4.3%2.3%2.4%1.9%2%2.9%2.4%1.9%
2020-02-012.1%4.4%2.4%2.4%1.9%2%2.8%2.3%2%
2020-03-012.2%4.8%2.6%2.8%2%2%3%2.1%2.1%
2020-04-012.3%5.5%3.1%2.8%1.9%1.9%3.5%2.3%2.2%
2020-05-012.1%5.5%3%2.8%1.7%1.9%3.6%2.3%2.2%
2020-06-012%5.3%2.9%2.3%1.6%1.8%3.5%2.2%2.1%
2020-07-012%5%2.9%2.6%1.5%1.8%3.4%2.2%2%
2020-08-011.9%4.7%2.6%2.6%1.5%1.8%3.3%2.3%2%
2020-09-011.9%4.9%2.5%2.5%1.5%1.7%3.1%2.2%1.9%
2020-10-012.1%4.9%2.7%2.5%1.6%1.8%3.2%2.2%1.9%
2020-11-012.3%5.3%3%2.5%1.7%1.9%3.4%2.5%2.1%
2020-12-012.5%5.3%3.1%2.8%1.9%2%3.8%2.5%2.2%
2021-01-012.8%5.9%3.5%3%2%2.1%3.9%2.5%2.4%
2021-02-012.9%6.3%3.6%3%2.1%2.2%3.9%2.3%2.6%
2021-03-012.7%6.6%3.4%3.1%2.2%2.4%4.1%2.2%2.6%
2021-04-012.7%6.9%3%2.9%2.1%2.4%4.2%2.2%2.6%
2021-05-012.8%6.2%2.7%3%2.1%2.4%3.7%2.2%2.6%
2021-06-012.8%5.9%2.7%3.2%2.2%2.4%3.6%2.1%2.5%
2021-07-012.7%5.7%2.7%3.4%2.2%2.4%3.7%2%2.4%
2021-08-012.7%5.2%2.6%3.6%2.4%2.5%4.1%2%2.4%
2021-09-012.7%5.1%2.6%3.6%2.6%2.5%4%2%2.4%
2021-10-012.9%5.3%2.6%3.4%2.7%2.4%4%2.1%2.4%
2021-11-013%5.5%2.7%3.3%2.8%2.4%4%2.2%2.5%
2021-12-013.2%6%2.9%3.4%3%2.5%4.2%2.3%2.6%
2022-01-013.5%6.2%3.2%3.7%3.1%2.6%4.2%2.3%2.7%
2022-02-013.4%5.7%3.1%3.4%3.2%2.6%4.1%2.2%2.6%
2022-03-013.3%5.7%3.1%3.4%3.2%2.6%4%2.1%2.6%
2022-04-013.2%5.1%3%3.4%3.2%2.6%4.1%2.1%2.5%
2022-05-013.1%5.2%2.9%3.4%3.2%2.6%4%2%2.5%
2022-06-013%5.2%2.7%3.1%3%2.7%3.8%2%2.5%
2022-07-013%5.2%2.6%3.2%2.9%2.6%3.8%1.9%2.4%
2022-08-012.8%5%2.5%3.1%2.7%2.5%3.6%1.9%2.5%
2022-09-012.5%4.8%2.4%3%2.6%2.5%3.4%1.8%2.4%
2022-10-012.4%4.6%2.3%2.7%2.4%2.4%3.5%1.8%2.3%
2022-11-012.3%4.3%2.3%2.6%2.3%2.3%3.3%1.9%2.3%
2022-12-012.2%4%2.2%2.5%2.2%2.3%3%1.8%2.2%
2023-01-012.2%3.7%2%2.4%2.2%2.2%2.8%1.8%2.1%
2023-02-012.1%3.4%2%2.3%2.1%2.3%2.6%1.7%2.1%
2023-03-012.1%3.4%2%2.6%1.9%2.4%2.6%1.7%2%
2023-04-011.9%3.4%1.9%2.5%1.8%2.3%2.4%1.7%2%
2023-05-011.9%3.3%1.8%2.4%1.8%2.1%2.4%1.7%1.9%
2023-06-011.8%3.4%1.7%2.3%1.7%2.1%2.3%1.6%1.8%
2023-07-011.9%3.8%1.8%2.4%1.7%2.1%2.3%1.6%1.9%
2023-08-011.9%3.8%1.8%2.5%1.7%2.1%2.4%1.6%1.9%
2023-09-012%3.7%1.8%2.3%1.8%2.1%2.4%1.6%1.8%
2023-10-012.1%3.8%1.8%2.2%1.8%2.1%2.4%1.8%1.9%
2023-11-012.2%3.8%1.9%2.1%1.9%2.1%2.4%2%2%
2023-12-012.4%4.1%2.1%2.3%1.9%2.1%2.4%2%2%
2024-01-012.5%4.3%2.2%2.4%2%2.3%2.4%2%2%
2024-02-012.5%4.2%2.3%2.3%2.1%2.3%2.4%2%2%
2024-03-012.5%4.3%2.3%2.4%2.1%2.3%2.3%2%2%
2024-04-012.6%4.6%2.3%2.4%2%2.2%2.4%2%2%
2024-05-012.7%4.5%2.4%2.4%2.1%2.2%2.3%2.1%2%
2024-06-012.8%4.6%2.4%2.4%2.2%2.2%2.4%2.1%1.9%
2024-07-013%5.5%2.6%2.4%2.2%2.3%2.6%2.1%2%
2024-08-013.1%5.7%2.6%2.5%2.3%2.4%2.9%2.1%2%
2024-09-013.2%5.5%2.7%2.6%2.4%2.3%2.8%2.1%1.9%
2024-10-013.3%5.7%2.8%2.5%2.5%2.3%2.9%2.2%2%
2024-11-013.4%6%3%2.8%2.6%2.3%2.9%2.4%2%
2024-12-013.5%6.5%3.2%2.8%2.7%2.4%2.8%2.3%2%
2025-01-013.7%6.6%3.4%3%2.7%2.5%2.8%2.3%2.1%
2025-02-013.8%6.5%3.5%3.1%2.8%2.6%2.8%2.3%2.1%
2025-03-013.9%6.8%3.6%3.5%2.8%2.7%3%2.5%2.2%
2025-04-014.1%7.3%4%3.5%2.8%2.8%3%2.6%2.2%
2025-05-014.3%7.6%4%3.6%2.8%2.9%3%2.5%2.2%
2025-06-014.6%8.2%4.4%4.1%3%3.1%3.2%2.6%2.3%
2025-07-014.9%8.9%4.5%4.7%3.2%3.2%3.3%2.7%2.3%
2025-08-015.2%9.5%4.9%4.8%3.4%3.6%3.6%2.6%2.3%
2025-09-015.6%9.5%4.9%4.8%3.6%3.6%3.4%2.6%2.3%
2025-10-016.2%10.6%5.5%5.1%3.9%3.6%3.3%3%2.3%
2025-11-017.3%11.3%5.9%5.4%4.2%3.7%3.5%3.3%2.5%
2025-12-019.3%12.2%6.7%5.8%4.4%3.9%3.7%3.5%2.6%
2026-01-0111.8%12.2%7%5.9%4.6%4.2%3.8%3.4%2.7%
2026-02-0113.3%11.8%7.2%5.9%5%4.4%3.5%3.3%2.8%
2026-03-0114.6%11.8%7.6%6.4%5.3%4.6%3.7%3.7%3%
2026-04-0116.2%13%8.3%6.9%5.5%4.9%4.2%4.1%3.1%
2026-05-0117.1%13.8%8.9%7%5.8%5.3%4.6%4.2%3.1%

Source: Työmarkkinadata, share of job ads mentioning AI by country, monthly average since Jan 2019, data through May 2026tyomarkkinadata.fi

Download image: Canada leads in AI job ads and is rising fastest

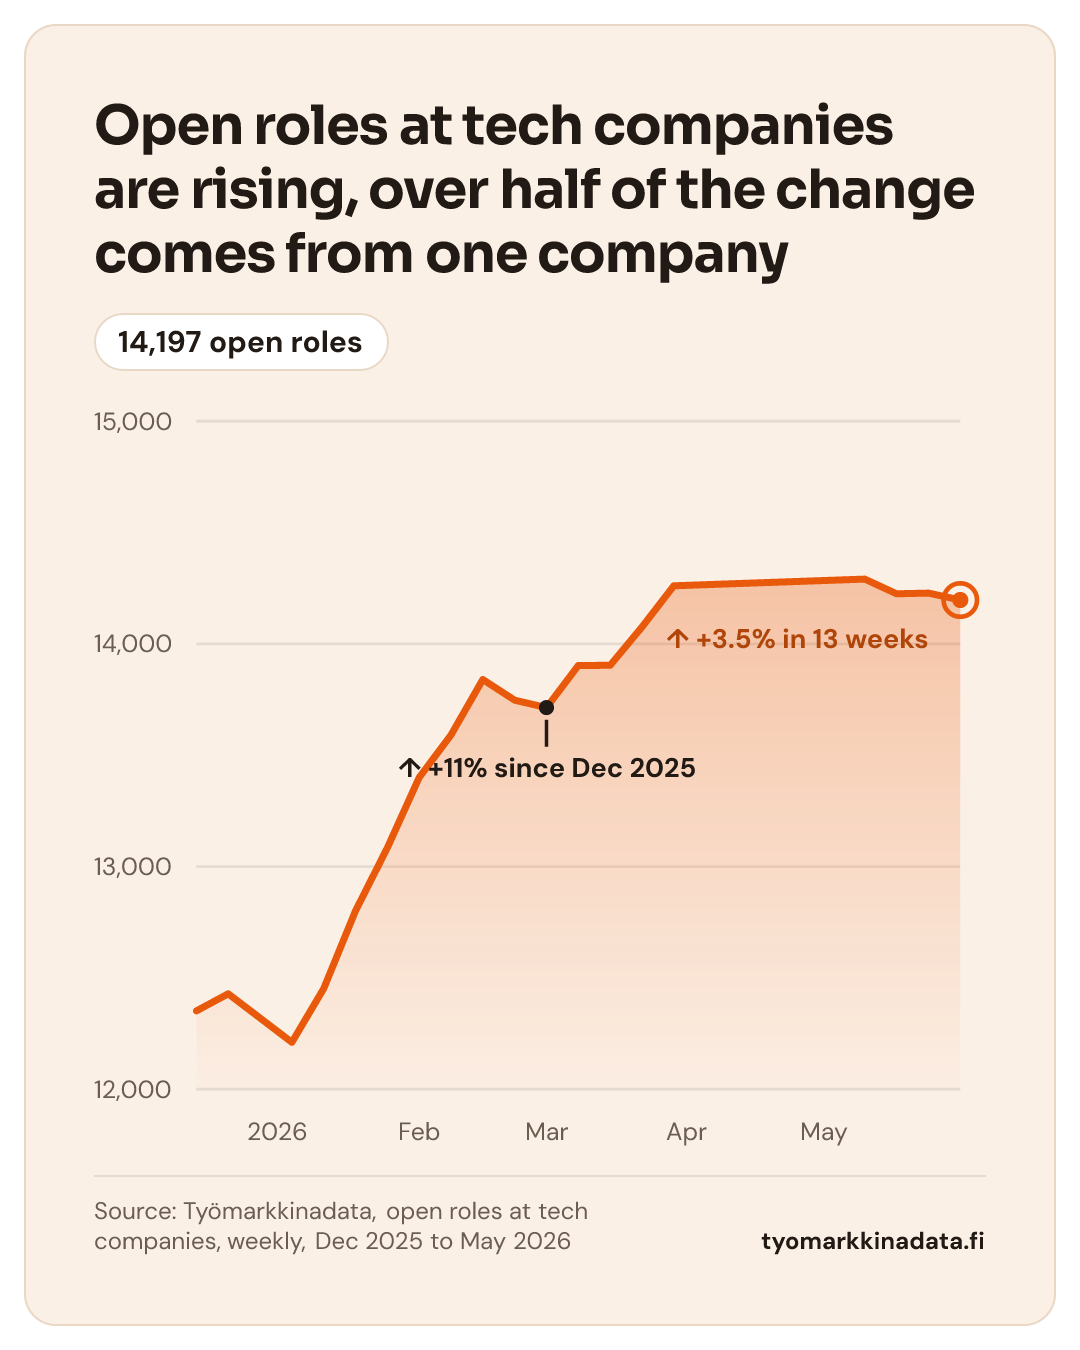
Open roles at tech companies are rising, over half of the change comes from one company

14,197 open roles

Open roles at tech companies are rising, over half of the change comes from one company: figures
DateOpen roles at tech companies
2025-12-1412,352
2025-12-2112,429
2025-12-2812,320
2026-01-0412,211
2026-01-1112,452
2026-01-1812,801
2026-01-2513,084
2026-02-0113,400
2026-02-0813,591
2026-02-1513,840
2026-02-2213,747
2026-03-0113,714
2026-03-0813,903
2026-03-1513,904
2026-03-2214,076
2026-03-2914,261
2026-05-1014,291
2026-05-1714,225
2026-05-2414,228
2026-05-3114,197

Source: Työmarkkinadata, open roles at tech companies, weekly, Dec 2025 to May 2026tyomarkkinadata.fi

Download image: Open roles at tech companies are rising, over half of the change comes from one company

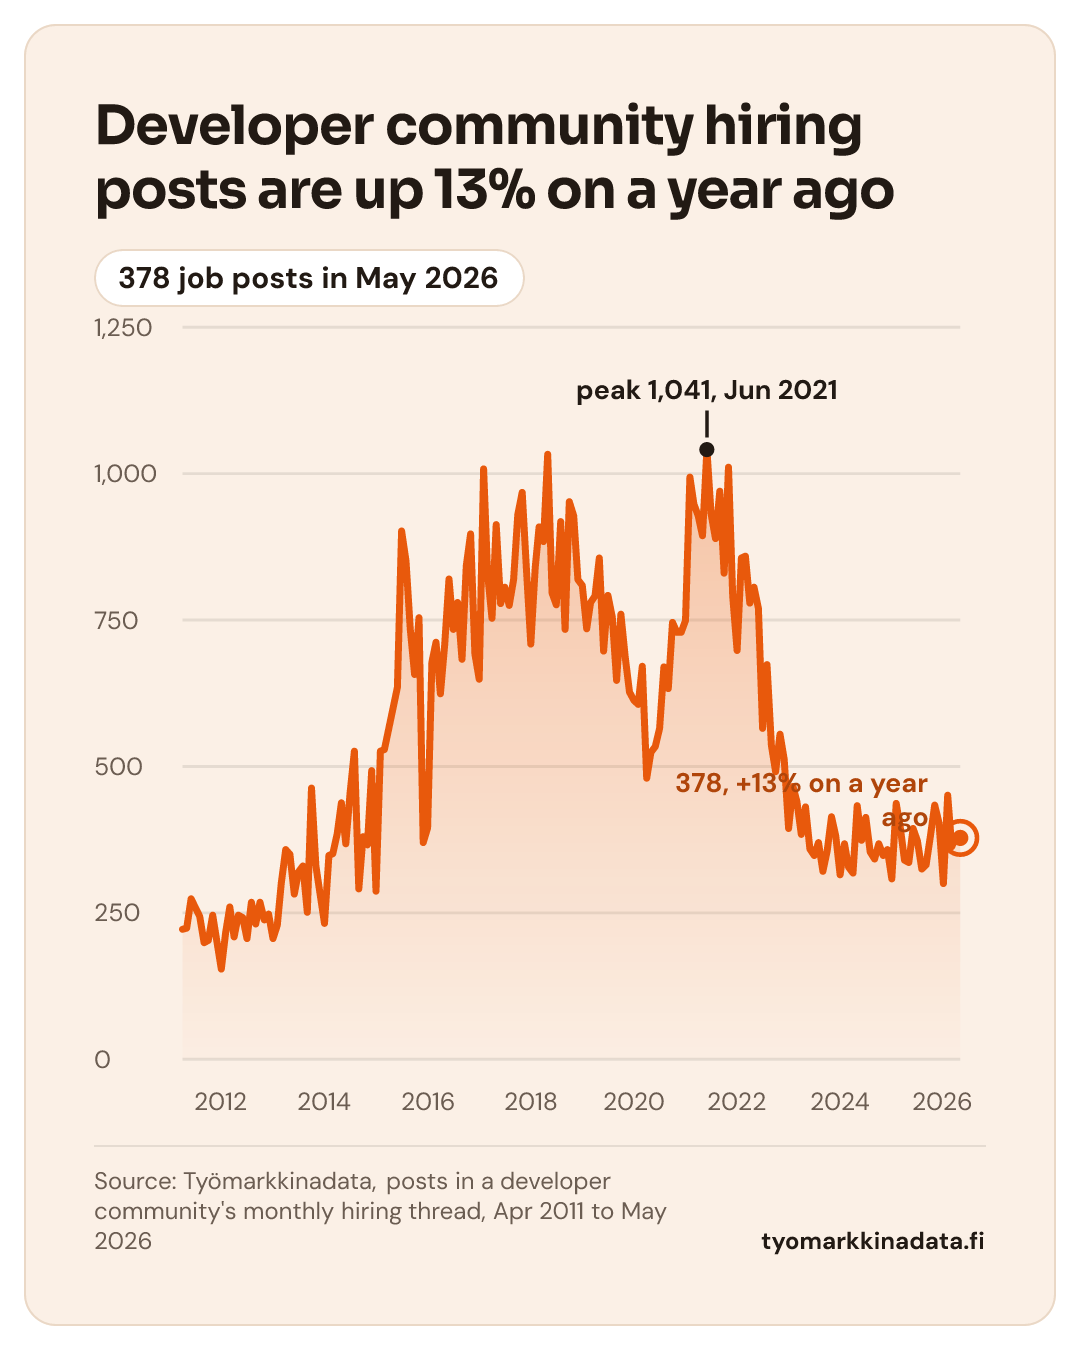
Developer community hiring posts are up 13% on a year ago

378 job posts in May 2026

Developer community hiring posts are up 13% on a year ago: figures
DateDeveloper community hiring posts
2011-04-01222
2011-05-01224
2011-06-01274
2011-08-01244
2011-09-01199
2011-10-01203
2011-11-01246
2012-01-01154
2012-02-01217
2012-03-01260
2012-04-01209
2012-05-01246
2012-06-01242
2012-07-01206
2012-08-01268
2012-09-01231
2012-10-01268
2012-11-01238
2012-12-01248
2013-01-01206
2013-02-01229
2013-03-01301
2013-04-01358
2013-05-01350
2013-06-01282
2013-07-01320
2013-08-01330
2013-09-01251
2013-10-01463
2013-11-01330
2013-12-01282
2014-01-01232
2014-02-01348
2014-03-01351
2014-04-01385
2014-05-01438
2014-06-01368
2014-07-01455
2014-08-01526
2014-09-01291
2014-10-01380
2014-11-01366
2014-12-01493
2015-01-01287
2015-02-01526
2015-03-01529
2015-06-01635
2015-07-01902
2015-08-01851
2015-09-01734
2015-10-01657
2015-11-01754
2015-12-01370
2016-01-01395
2016-02-01678
2016-03-01712
2016-04-01624
2016-05-01708
2016-06-01820
2016-07-01734
2016-08-01780
2016-09-01683
2016-10-01843
2016-11-01897
2016-12-01692
2017-01-01649
2017-02-011,008
2017-03-01829
2017-04-01753
2017-05-01913
2017-06-01778
2017-07-01806
2017-08-01775
2017-09-01819
2017-10-01930
2017-11-01968
2017-12-01838
2018-01-01709
2018-02-01839
2018-03-01909
2018-04-01884
2018-05-011,033
2018-06-01796
2018-07-01776
2018-08-01918
2018-09-01734
2018-10-01952
2018-11-01928
2018-12-01819
2019-01-01809
2019-02-01735
2019-03-01780
2019-04-01791
2019-05-01856
2019-06-01697
2019-07-01792
2019-08-01755
2019-09-01647
2019-10-01760
2019-11-01687
2019-12-01627
2020-01-01613
2020-02-01606
2020-03-01671
2020-04-01480
2020-05-01524
2020-06-01534
2020-07-01565
2020-08-01670
2020-09-01633
2020-10-01746
2020-11-01729
2020-12-01729
2021-01-01749
2021-02-01994
2021-03-01948
2021-04-01928
2021-05-01894
2021-06-011,041
2021-07-01931
2021-08-01889
2021-09-01970
2021-10-01830
2021-11-011,011
2021-12-01791
2022-01-01698
2022-02-01856
2022-03-01859
2022-04-01779
2022-05-01806
2022-06-01770
2022-07-01565
2022-08-01674
2022-09-01536
2022-10-01491
2022-11-01555
2022-12-01512
2023-01-01394
2023-02-01466
2023-03-01440
2023-04-01384
2023-05-01431
2023-06-01359
2023-07-01348
2023-08-01370
2023-09-01321
2023-10-01356
2023-11-01414
2023-12-01381
2024-01-01315
2024-02-01368
2024-03-01328
2024-04-01318
2024-05-01433
2024-06-01374
2024-07-01413
2024-08-01354
2024-09-01342
2024-10-01368
2024-11-01348
2024-12-01358
2025-01-01308
2025-02-01437
2025-03-01397
2025-04-01340
2025-05-01336
2025-06-01394
2025-07-01373
2025-08-01325
2025-09-01332
2025-10-01381
2025-11-01434
2025-12-01404
2026-01-01300
2026-02-01451
2026-03-01363
2026-04-01379
2026-05-01378

Source: Työmarkkinadata, posts in a developer community's monthly hiring thread, Apr 2011 to May 2026tyomarkkinadata.fi

Download image: Developer community hiring posts are up 13% on a year ago

Method and sources

Latest figures June 30, 2026

  • Job pages of tech and growth companies: open roles per week by job family. It shows hiring at venture-backed companies, not the whole job market.
  • Tech hiring posts every month since 2011.
  • Share of job ads mentioning AI by country, monthly average since 2019. The share is a percentage of all of the country's ads.
  • Työmarkkinadata's own collection: open tech job ads from dozens of international recruitment systems. A skill's share is the percentage of ads that mention it.
  • Job vacancy rate: open vacancies as a percentage of all jobs, quarterly.

How we collect and count our own figures

See the full history and the hidden jobs

Pro shows postings back to May 2025 and companies hiring without a public posting, and tracks unlimited regions, companies and skills with email alerts. 14 days free, no card.
The global job market, June 2026 | Työmarkkinadata