Global job market pulse

The global job market, September 2026

Once a month we put together four charts on how the job market is moving outside Finland: how much fast-growing companies are hiring and for which roles, how many job ads mention AI in different countries, and which skills international tech job ads ask for.

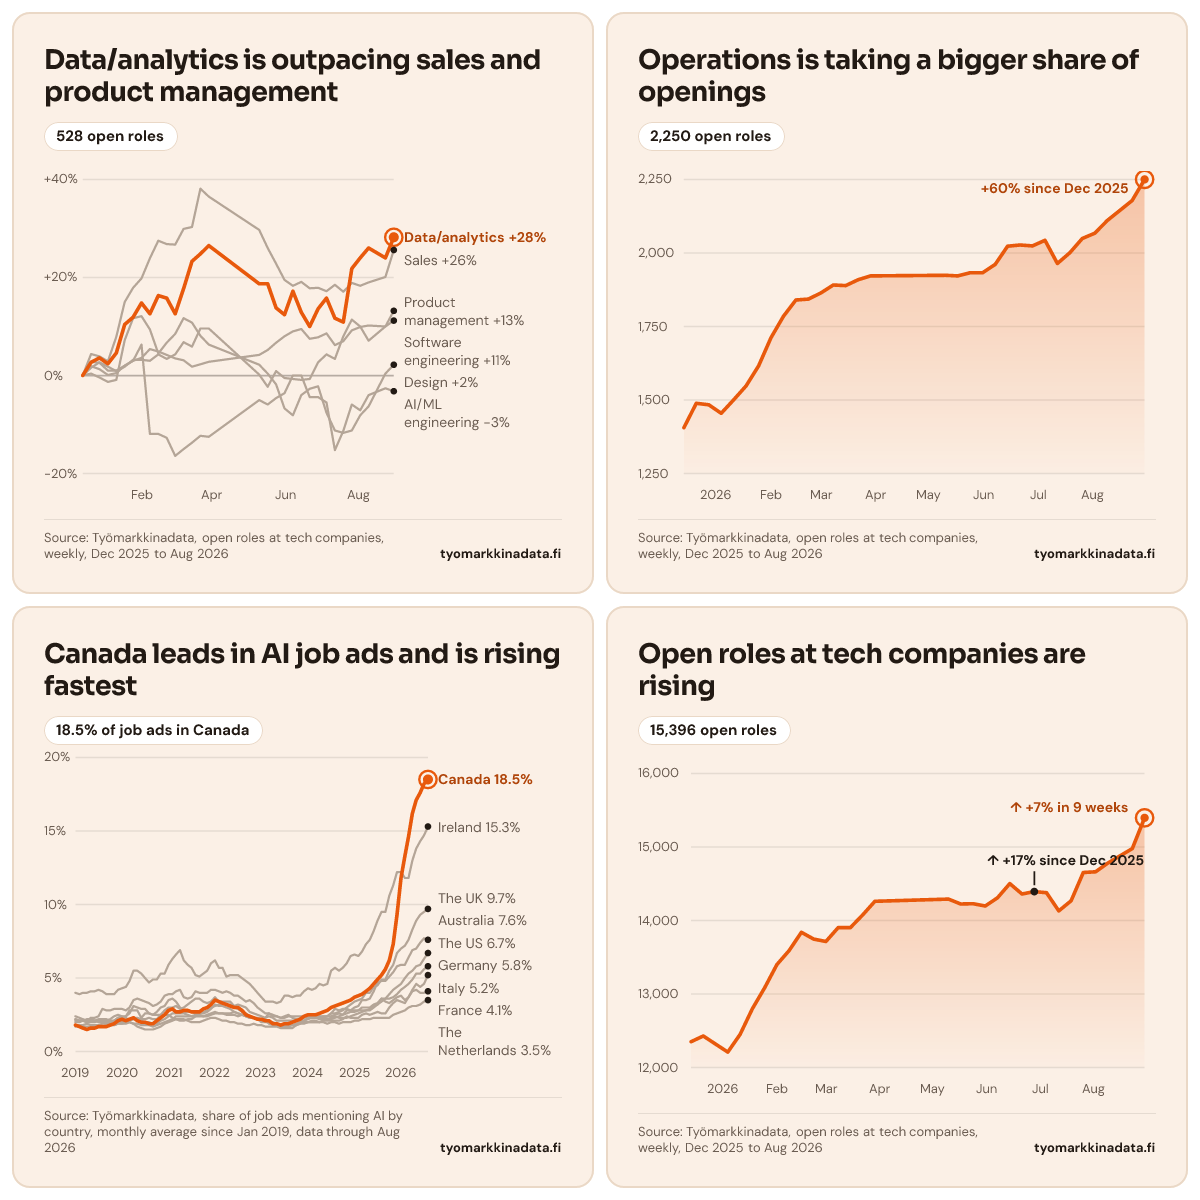
This month in charts

Every card can be downloaded as an image and shared.

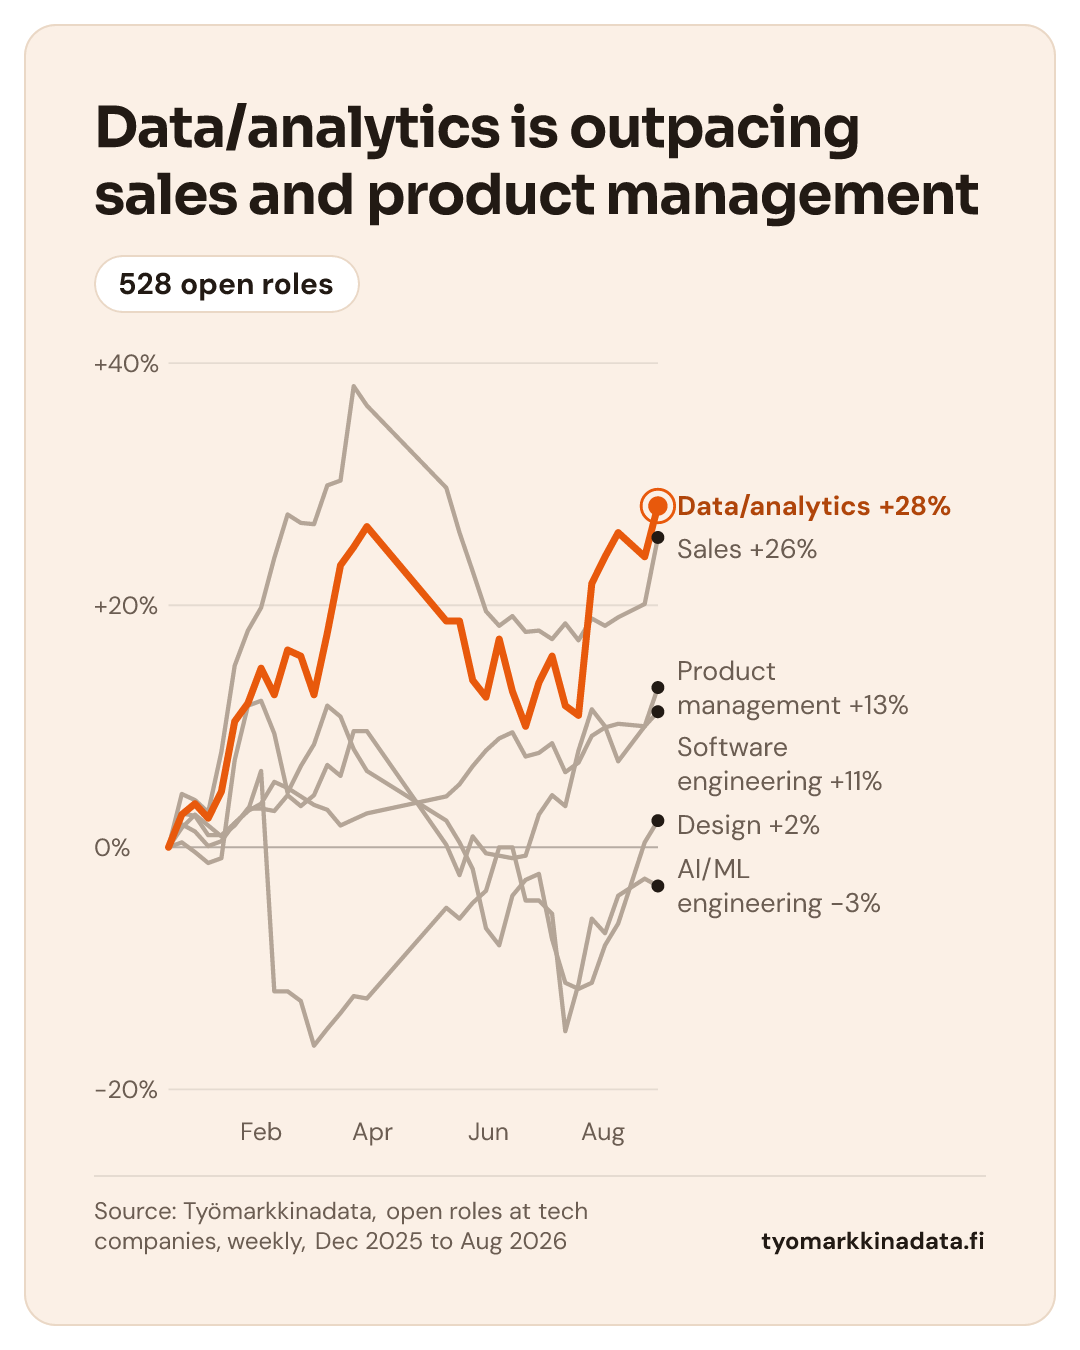
Data/analytics is outpacing sales and product management

528 open roles

Data/analytics is outpacing sales and product management: figures
DateSoftware engineeringAI/ML engineeringData/analyticsProduct managementDesignSales
2025-12-140%0%0%0%0%0%
2025-12-21+2%+3%+3%+2%0%+4%
2025-12-28+1%+3%+4%+3%0%+4%
2026-01-040%+1%+2%+2%-1%+3%
2026-01-11+1%+1%+5%+1%-1%+8%
2026-01-18+2%+2%+10%+2%+7%+15%
2026-01-25+3%+3%+12%+3%+12%+18%
2026-02-01+4%+6%+15%+3%+12%+20%
2026-02-08+5%-12%+13%+3%+9%+24%
2026-02-15+5%-12%+16%+4%+5%+28%
2026-02-22+4%-13%+16%+3%+7%+27%
2026-03-01+4%-16%+13%+4%+9%+27%
2026-03-08+3%-15%+18%+7%+12%+30%
2026-03-15+2%-14%+23%+6%+11%+30%
2026-03-22+2%-12%+25%+10%+8%+38%
2026-03-29+3%-12%+27%+10%+6%+37%
2026-05-10+4%-5%+19%0%+2%+30%
2026-05-17+5%-6%+19%-2%0%+26%
2026-05-24+7%-5%+14%+1%-2%+23%
2026-05-31+8%-4%+12%0%-7%+20%
2026-06-07+9%0%+17%-1%-8%+18%
2026-06-14+10%0%+13%-1%-4%+19%
2026-06-21+8%-4%+10%-1%-3%+18%
2026-06-28+8%-4%+14%+3%-2%+18%
2026-07-05+9%-5%+16%+4%-8%+17%
2026-07-12+6%-15%+12%+3%-11%+19%
2026-07-19+7%-11%+11%+8%-12%+17%
2026-07-26+9%-6%+22%+11%-11%+19%
2026-08-02+10%-7%+24%+10%-8%+18%
2026-08-09+10%-4%+26%+7%-6%+19%
2026-08-23+10%-3%+24%+10%0%+20%
2026-08-30+11%-3%+28%+13%+2%+26%

Source: Työmarkkinadata, open roles at tech companies, weekly, Dec 2025 to Aug 2026tyomarkkinadata.fi

Download image: Data/analytics is outpacing sales and product management

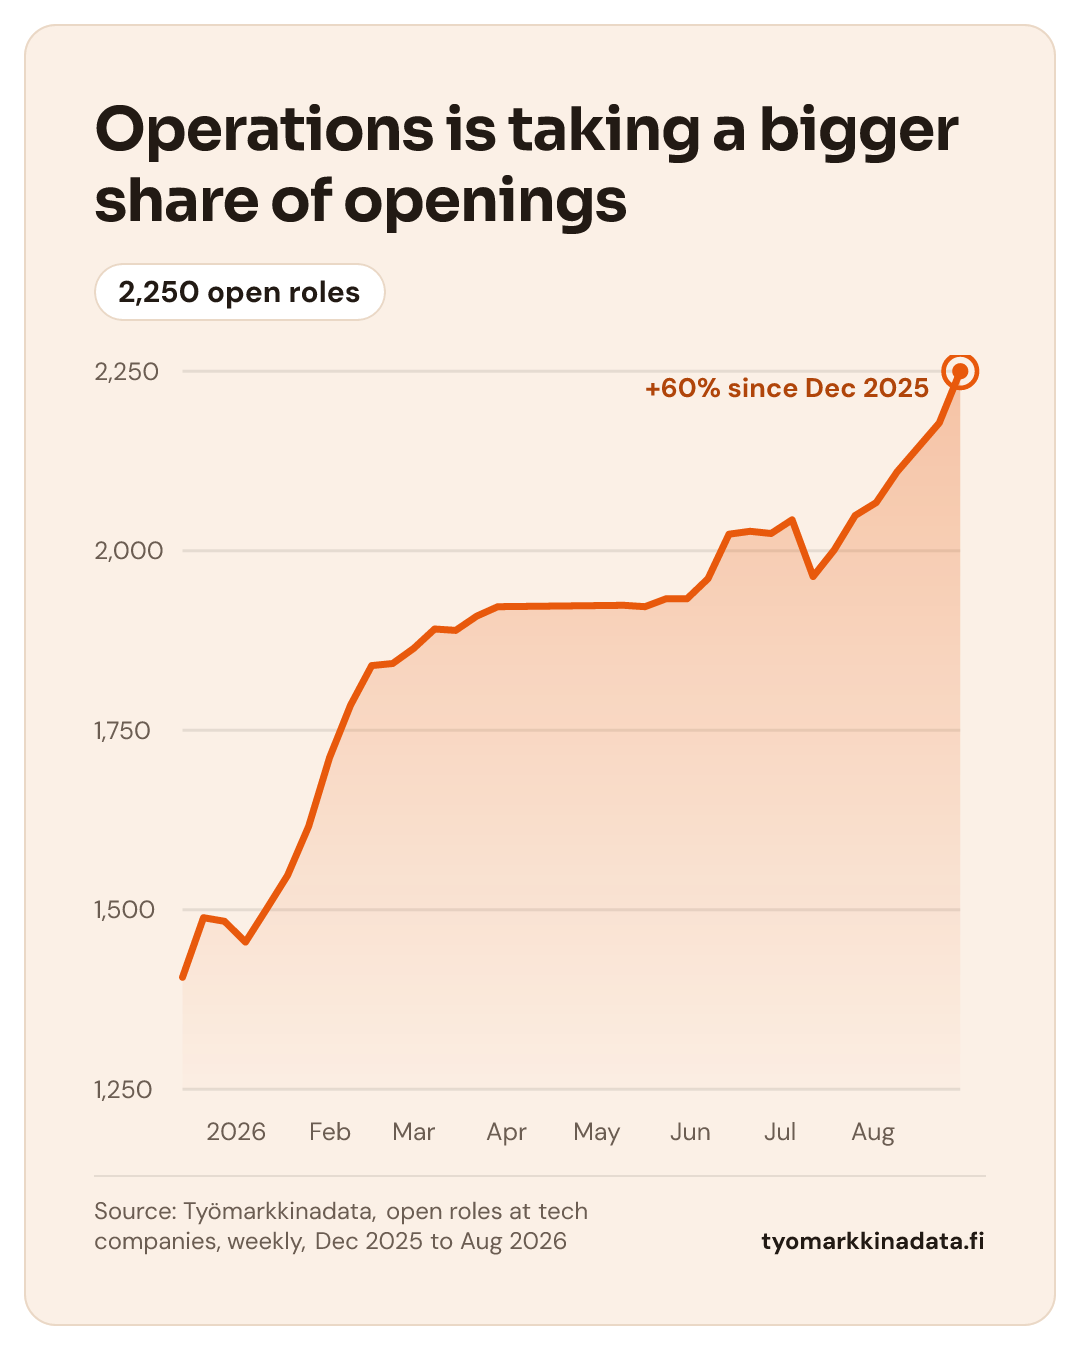
Operations is taking a bigger share of openings

2,250 open roles

Operations is taking a bigger share of openings: figures
DateOperations
2025-12-141,406
2025-12-211,489
2025-12-281,484
2026-01-041,455
2026-01-111,501
2026-01-181,548
2026-01-251,616
2026-02-011,712
2026-02-081,785
2026-02-151,840
2026-02-221,843
2026-03-011,864
2026-03-081,891
2026-03-151,889
2026-03-221,909
2026-03-291,922
2026-05-101,924
2026-05-171,922
2026-05-241,933
2026-05-311,933
2026-06-071,961
2026-06-142,023
2026-06-212,027
2026-06-282,024
2026-07-052,043
2026-07-121,964
2026-07-192,001
2026-07-262,049
2026-08-022,067
2026-08-092,110
2026-08-232,178
2026-08-302,250

Source: Työmarkkinadata, open roles at tech companies, weekly, Dec 2025 to Aug 2026tyomarkkinadata.fi

Download image: Operations is taking a bigger share of openings

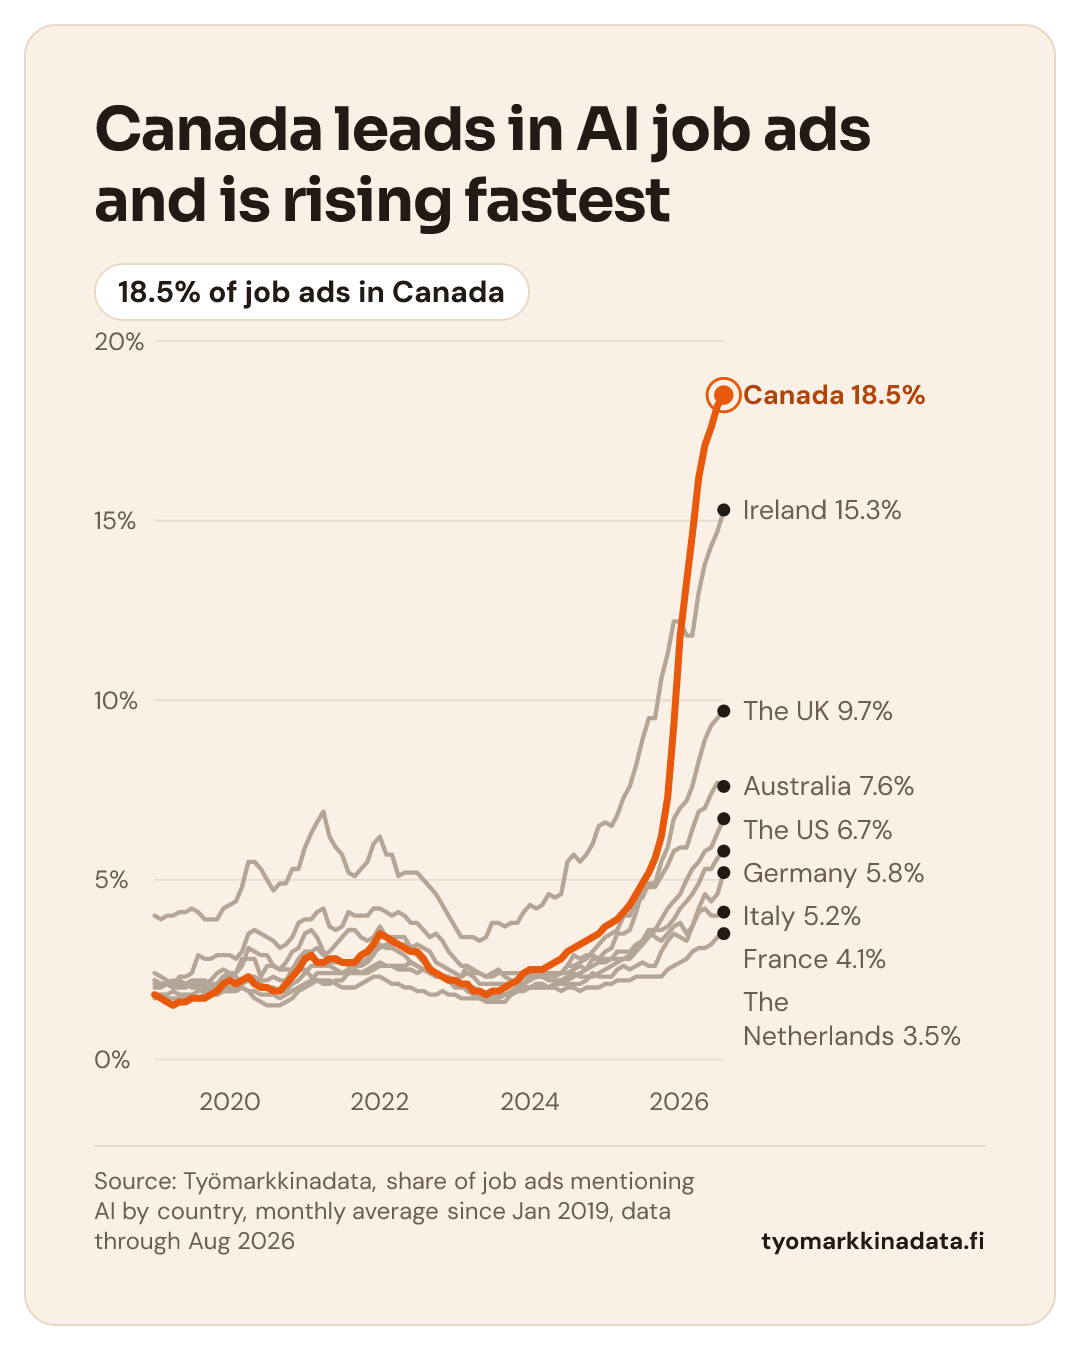
Canada leads in AI job ads and is rising fastest

18.5% of job ads in Canada

Canada leads in AI job ads and is rising fastest: figures
DateCanadaIrelandThe UKAustraliaThe USGermanyItalyFranceThe Netherlands
2019-01-011.8%4%2.1%2.2%1.7%2%2.2%2.4%1.8%
2019-02-011.7%3.9%2.1%2.1%1.8%2%2.1%2.3%1.8%
2019-03-011.6%4%2.1%2.1%1.7%2.1%2.1%2.2%1.8%
2019-04-011.5%4%2%2.2%1.7%2.1%2%2.1%1.9%
2019-05-011.6%4.1%2%2.2%1.7%2.1%2.3%2.1%1.8%
2019-06-011.6%4.1%2%2.1%1.7%2.1%2.3%2.1%1.8%
2019-07-011.7%4.2%2.1%2.2%1.7%2%2.4%2.1%1.8%
2019-08-011.7%4.1%2%2.2%1.7%2%2.9%2.1%1.9%
2019-09-011.7%3.9%2%2.2%1.8%1.9%2.8%2.1%1.9%
2019-10-011.8%3.9%2%2.1%1.8%1.9%2.8%2.2%1.9%
2019-11-011.9%3.9%2.1%2.1%1.8%2%2.9%2.4%1.8%
2019-12-012.1%4.2%2.3%2.3%1.9%2%2.9%2.5%1.9%
2020-01-012.2%4.3%2.3%2.4%1.9%2%2.9%2.4%1.9%
2020-02-012.1%4.4%2.4%2.4%1.9%2%2.8%2.3%2%
2020-03-012.2%4.8%2.6%2.8%2%2%3%2.1%2.1%
2020-04-012.3%5.5%3.1%2.8%1.9%1.9%3.5%2.3%2.2%
2020-05-012.1%5.5%3%2.8%1.7%1.9%3.6%2.3%2.2%
2020-06-012%5.3%2.9%2.3%1.6%1.8%3.5%2.2%2.1%
2020-07-012%5%2.9%2.6%1.5%1.8%3.4%2.2%2%
2020-08-011.9%4.7%2.6%2.6%1.5%1.8%3.3%2.3%2%
2020-09-011.9%4.9%2.5%2.5%1.5%1.7%3.1%2.2%1.9%
2020-10-012.1%4.9%2.7%2.5%1.6%1.8%3.2%2.2%1.9%
2020-11-012.3%5.3%3%2.5%1.7%1.9%3.4%2.5%2.1%
2020-12-012.5%5.3%3.1%2.8%1.9%2%3.8%2.5%2.2%
2021-01-012.8%5.9%3.5%3%2%2.1%3.9%2.5%2.4%
2021-02-012.9%6.3%3.6%3%2.1%2.2%3.9%2.3%2.6%
2021-03-012.7%6.6%3.4%3.1%2.2%2.4%4.1%2.2%2.6%
2021-04-012.7%6.9%3%2.9%2.1%2.4%4.2%2.2%2.6%
2021-05-012.8%6.2%2.7%3%2.1%2.4%3.7%2.2%2.6%
2021-06-012.8%5.9%2.7%3.2%2.2%2.4%3.6%2.1%2.5%
2021-07-012.7%5.7%2.7%3.4%2.2%2.4%3.7%2%2.4%
2021-08-012.7%5.2%2.6%3.6%2.4%2.5%4.1%2%2.4%
2021-09-012.7%5.1%2.6%3.6%2.6%2.5%4%2%2.4%
2021-10-012.9%5.3%2.6%3.4%2.7%2.4%4%2.1%2.4%
2021-11-013%5.5%2.7%3.3%2.8%2.4%4%2.2%2.5%
2021-12-013.2%6%2.9%3.4%3%2.5%4.2%2.3%2.6%
2022-01-013.5%6.2%3.2%3.7%3.1%2.6%4.2%2.3%2.7%
2022-02-013.4%5.7%3.1%3.4%3.2%2.6%4.1%2.2%2.6%
2022-03-013.3%5.7%3.1%3.4%3.2%2.6%4%2.1%2.6%
2022-04-013.2%5.1%3%3.4%3.2%2.6%4.1%2.1%2.5%
2022-05-013.1%5.2%2.9%3.4%3.2%2.6%4%2%2.5%
2022-06-013%5.2%2.7%3.1%3%2.7%3.8%2%2.5%
2022-07-013%5.2%2.6%3.2%2.9%2.6%3.8%1.9%2.4%
2022-08-012.8%5%2.5%3.1%2.7%2.5%3.6%1.9%2.5%
2022-09-012.5%4.8%2.4%3%2.6%2.5%3.4%1.8%2.4%
2022-10-012.4%4.6%2.3%2.7%2.4%2.4%3.5%1.8%2.3%
2022-11-012.3%4.3%2.3%2.6%2.3%2.3%3.3%1.9%2.3%
2022-12-012.2%4%2.2%2.5%2.2%2.3%3%1.8%2.2%
2023-01-012.2%3.7%2%2.4%2.2%2.2%2.8%1.8%2.1%
2023-02-012.1%3.4%2%2.3%2.1%2.3%2.6%1.7%2.1%
2023-03-012.1%3.4%2%2.6%1.9%2.4%2.6%1.7%2%
2023-04-011.9%3.4%1.9%2.5%1.8%2.3%2.4%1.7%2%
2023-05-011.9%3.3%1.8%2.4%1.8%2.1%2.4%1.7%1.9%
2023-06-011.8%3.4%1.7%2.3%1.7%2.1%2.3%1.6%1.8%
2023-07-011.9%3.8%1.8%2.4%1.7%2.1%2.3%1.6%1.9%
2023-08-011.9%3.8%1.8%2.5%1.7%2.1%2.4%1.6%1.9%
2023-09-012%3.7%1.8%2.3%1.8%2.1%2.4%1.6%1.8%
2023-10-012.1%3.8%1.8%2.2%1.8%2.1%2.4%1.8%1.9%
2023-11-012.2%3.8%1.9%2.1%1.9%2.1%2.4%2%2%
2023-12-012.4%4.1%2.1%2.3%1.9%2.1%2.4%2%2%
2024-01-012.5%4.3%2.2%2.4%2%2.3%2.4%2%2%
2024-02-012.5%4.2%2.3%2.3%2.1%2.3%2.4%2%2%
2024-03-012.5%4.3%2.3%2.4%2.1%2.3%2.3%2%2%
2024-04-012.6%4.6%2.3%2.4%2%2.2%2.4%2%2%
2024-05-012.7%4.5%2.4%2.4%2.1%2.2%2.3%2.1%2%
2024-06-012.8%4.6%2.4%2.4%2.2%2.2%2.4%2.1%1.9%
2024-07-013%5.5%2.6%2.4%2.2%2.3%2.6%2.1%2%
2024-08-013.1%5.7%2.6%2.5%2.3%2.4%2.9%2.1%2%
2024-09-013.2%5.5%2.7%2.6%2.4%2.3%2.8%2.1%1.9%
2024-10-013.3%5.7%2.8%2.5%2.5%2.3%2.9%2.2%2%
2024-11-013.4%6%3%2.8%2.6%2.3%2.9%2.4%2%
2024-12-013.5%6.5%3.2%2.8%2.7%2.4%2.8%2.3%2%
2025-01-013.7%6.6%3.4%3%2.7%2.5%2.8%2.3%2.1%
2025-02-013.8%6.5%3.5%3.1%2.8%2.6%2.8%2.3%2.1%
2025-03-013.9%6.8%3.6%3.5%2.8%2.7%3%2.5%2.2%
2025-04-014.1%7.3%4%3.5%2.8%2.8%3%2.6%2.2%
2025-05-014.3%7.6%4%3.6%2.8%2.9%3%2.5%2.2%
2025-06-014.6%8.2%4.4%4.1%3%3.1%3.2%2.6%2.3%
2025-07-014.9%8.9%4.5%4.7%3.2%3.2%3.3%2.7%2.3%
2025-08-015.2%9.5%4.9%4.8%3.4%3.6%3.6%2.6%2.3%
2025-09-015.6%9.5%4.9%4.8%3.6%3.6%3.4%2.6%2.3%
2025-10-016.2%10.6%5.5%5.1%3.9%3.6%3.3%3%2.3%
2025-11-017.3%11.3%5.9%5.4%4.2%3.7%3.5%3.3%2.5%
2025-12-019.3%12.2%6.7%5.8%4.4%3.9%3.7%3.5%2.6%
2026-01-0111.8%12.2%7%5.9%4.6%4.2%3.8%3.4%2.7%
2026-02-0113.3%11.8%7.2%5.9%5%4.4%3.5%3.3%2.8%
2026-03-0114.6%11.8%7.6%6.4%5.3%4.6%3.7%3.7%3%
2026-04-0116.2%13%8.3%6.9%5.5%4.9%4.2%4.1%3.1%
2026-05-0117.1%13.8%8.9%7%5.8%5.3%4.6%4.2%3.1%
2026-06-0117.6%14.3%9.3%7.4%5.9%5.3%4.4%4%3.2%
2026-07-0118.2%14.7%9.5%7.7%6.3%5.6%4.6%4%3.4%
2026-08-0118.5%15.3%9.7%7.6%6.7%5.8%5.2%4.1%3.5%

Source: Työmarkkinadata, share of job ads mentioning AI by country, monthly average since Jan 2019, data through Aug 2026tyomarkkinadata.fi

Download image: Canada leads in AI job ads and is rising fastest

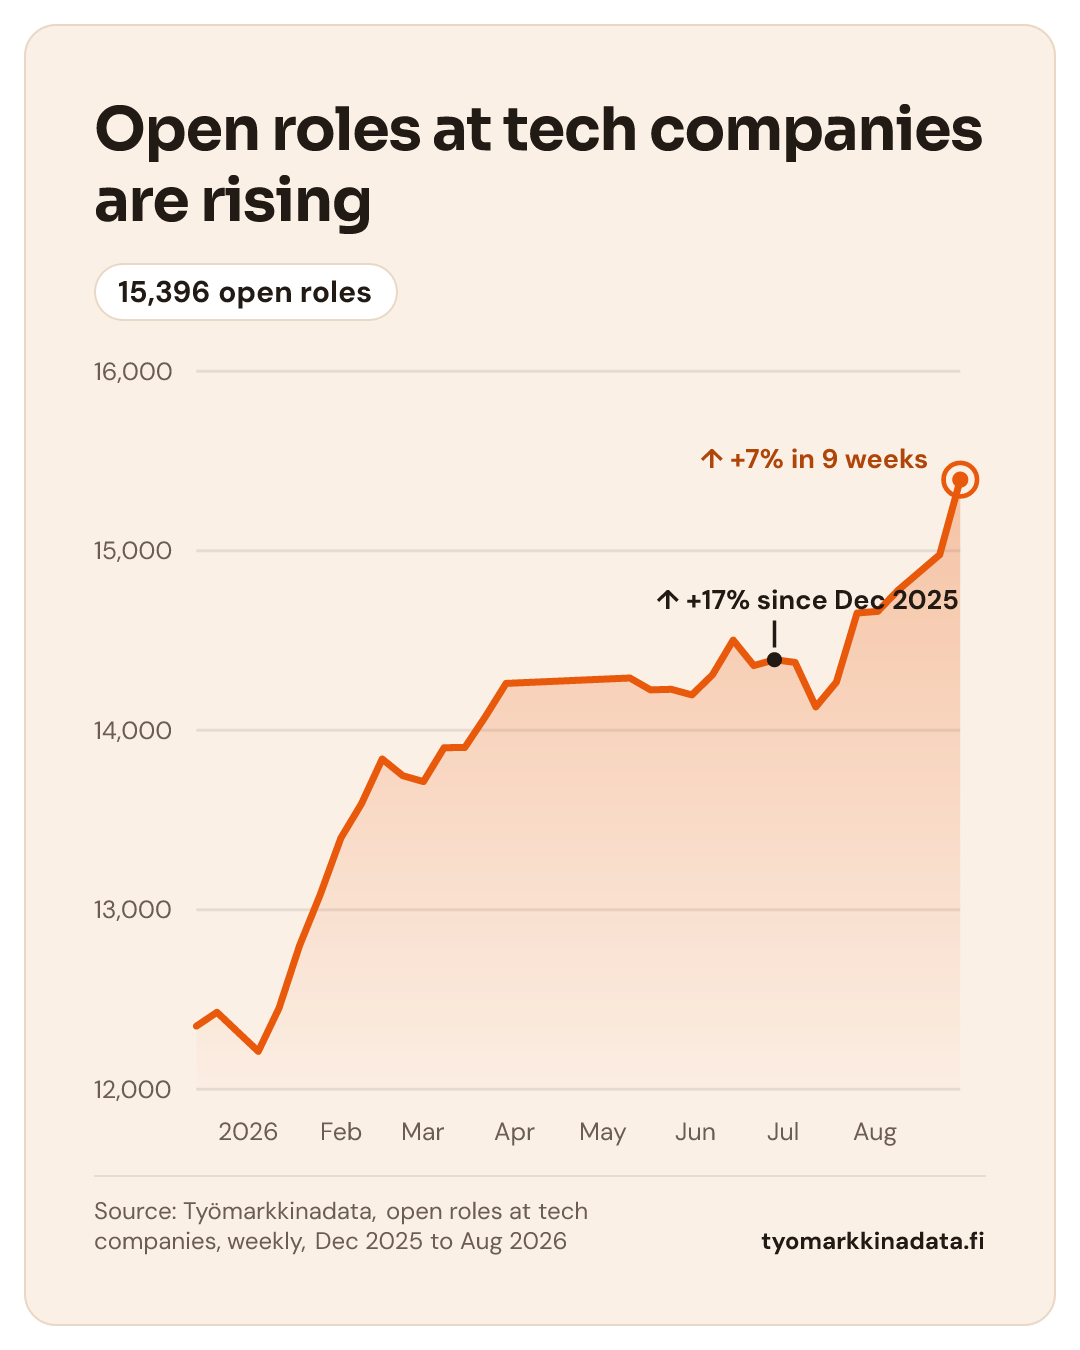
Open roles at tech companies are rising

15,396 open roles

Open roles at tech companies are rising: figures
DateOpen roles at tech companies
2025-12-1412,352
2025-12-2112,429
2025-12-2812,320
2026-01-0412,211
2026-01-1112,452
2026-01-1812,801
2026-01-2513,084
2026-02-0113,400
2026-02-0813,591
2026-02-1513,840
2026-02-2213,747
2026-03-0113,714
2026-03-0813,903
2026-03-1513,904
2026-03-2214,076
2026-03-2914,261
2026-05-1014,291
2026-05-1714,225
2026-05-2414,228
2026-05-3114,197
2026-06-0714,309
2026-06-1414,502
2026-06-2114,360
2026-06-2814,393
2026-07-0514,378
2026-07-1214,130
2026-07-1914,268
2026-07-2614,653
2026-08-0214,662
2026-08-0914,781
2026-08-2314,978
2026-08-3015,396

Source: Työmarkkinadata, open roles at tech companies, weekly, Dec 2025 to Aug 2026tyomarkkinadata.fi

Download image: Open roles at tech companies are rising

Method and sources

Latest figures August 31, 2026

  • Job pages of tech and growth companies: open roles per week by job family. It shows hiring at venture-backed companies, not the whole job market.
  • Tech hiring posts every month since 2011.
  • Share of job ads mentioning AI by country, monthly average since 2019. The share is a percentage of all of the country's ads.
  • Työmarkkinadata's own collection: open tech job ads from dozens of international recruitment systems. A skill's share is the percentage of ads that mention it.
  • Job vacancy rate: open vacancies as a percentage of all jobs, quarterly.

How we collect and count our own figures

See the full history and the hidden jobs

Pro shows postings back to May 2025 and companies hiring without a public posting, and tracks unlimited regions, companies and skills with email alerts. 14 days free, no card.
The global job market, September 2026 | Työmarkkinadata