Global job market pulse

The global job market, November 2026

Once a month we put together four charts on how the job market is moving outside Finland: how much fast-growing companies are hiring and for which roles, how many job ads mention AI in different countries, and which skills international tech job ads ask for.

This month in charts

Every card can be downloaded as an image and shared.

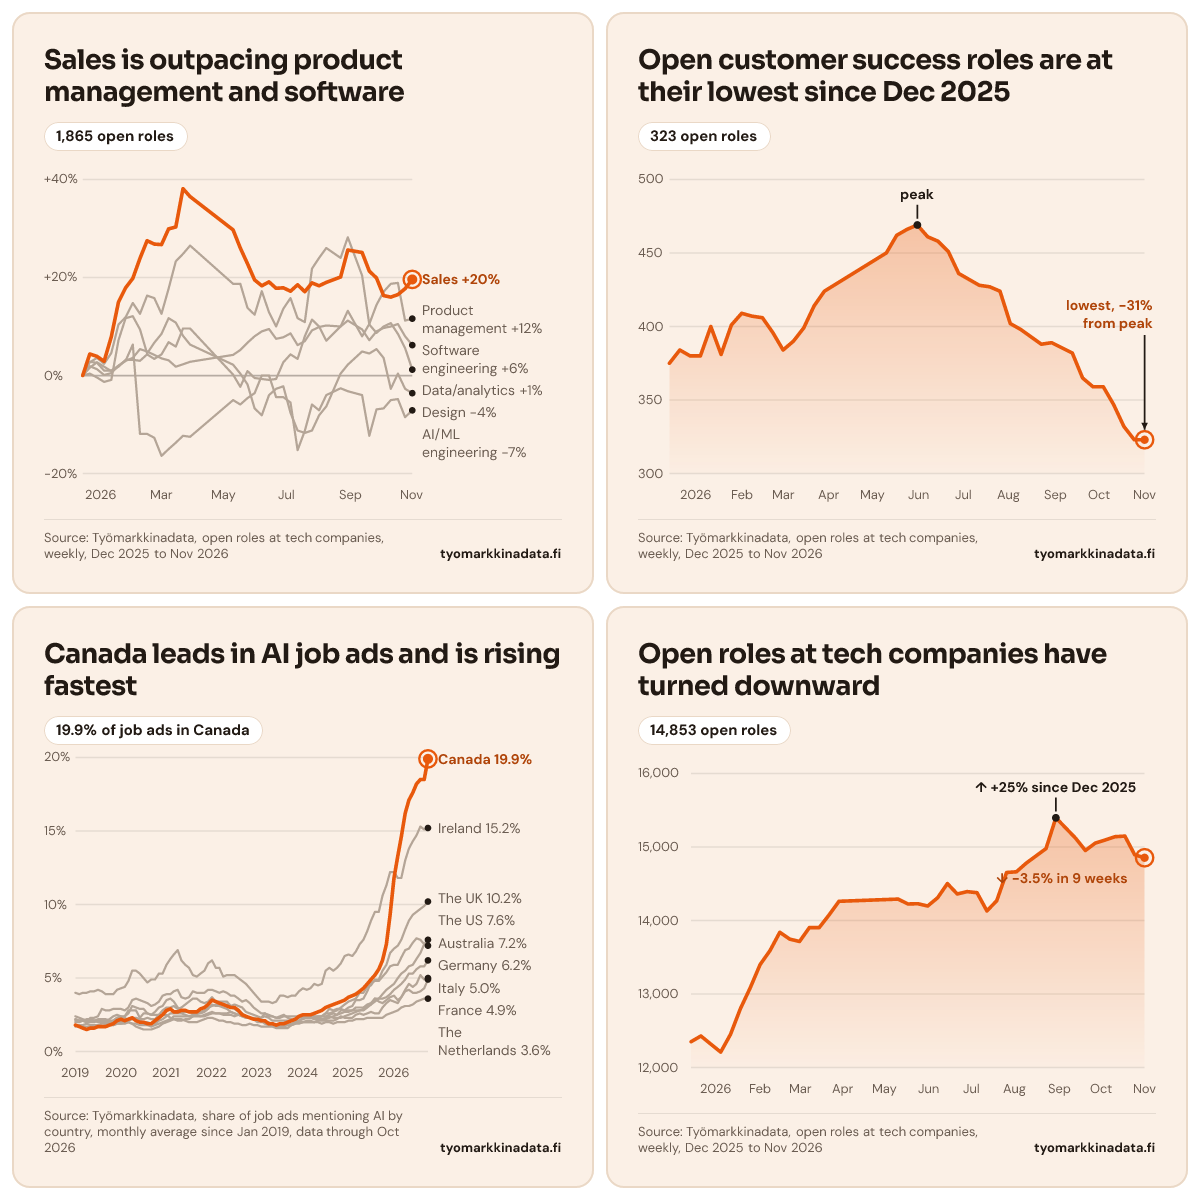
Sales is outpacing product management and software engineering

1,865 open roles

Sales is outpacing product management and software engineering: figures
DateSoftware engineeringAI/ML engineeringData/analyticsProduct managementDesignSales
2025-12-140%0%0%0%0%0%
2025-12-21+2%+3%+3%+2%0%+4%
2025-12-28+1%+3%+4%+3%0%+4%
2026-01-040%+1%+2%+2%-1%+3%
2026-01-11+1%+1%+5%+1%-1%+8%
2026-01-18+2%+2%+10%+2%+7%+15%
2026-01-25+3%+3%+12%+3%+12%+18%
2026-02-01+4%+6%+15%+3%+12%+20%
2026-02-08+5%-12%+13%+3%+9%+24%
2026-02-15+5%-12%+16%+4%+5%+28%
2026-02-22+4%-13%+16%+3%+7%+27%
2026-03-01+4%-16%+13%+4%+9%+27%
2026-03-08+3%-15%+18%+7%+12%+30%
2026-03-15+2%-14%+23%+6%+11%+30%
2026-03-22+2%-12%+25%+10%+8%+38%
2026-03-29+3%-12%+27%+10%+6%+37%
2026-05-10+4%-5%+19%0%+2%+30%
2026-05-17+5%-6%+19%-2%0%+26%
2026-05-24+7%-5%+14%+1%-2%+23%
2026-05-31+8%-4%+12%0%-7%+20%
2026-06-07+9%0%+17%-1%-8%+18%
2026-06-14+10%0%+13%-1%-4%+19%
2026-06-21+8%-4%+10%-1%-3%+18%
2026-06-28+8%-4%+14%+3%-2%+18%
2026-07-05+9%-5%+16%+4%-8%+17%
2026-07-12+6%-15%+12%+3%-11%+19%
2026-07-19+7%-11%+11%+8%-12%+17%
2026-07-26+9%-6%+22%+11%-11%+19%
2026-08-02+10%-7%+24%+10%-8%+18%
2026-08-09+10%-4%+26%+7%-6%+19%
2026-08-23+10%-3%+24%+10%0%+20%
2026-08-30+11%-3%+28%+13%+2%+26%
2026-09-13+9%-4%+20%+8%+5%+25%
2026-09-20+7%-12%+10%+11%+5%+21%
2026-09-27+9%-7%+9%+14%+5%+20%
2026-10-04+10%-7%+10%+17%+4%+16%
2026-10-11+10%-5%+11%+19%-3%+16%
2026-10-18+11%-5%+9%+19%0%+17%
2026-10-25+8%-8%+6%+11%-3%+18%
2026-11-01+6%-7%+1%+12%-4%+20%

Source: Työmarkkinadata, open roles at tech companies, weekly, Dec 2025 to Nov 2026tyomarkkinadata.fi

Download image: Sales is outpacing product management and software engineering

Open customer success roles are at their lowest since Dec 2025

323 open roles

Open customer success roles are at their lowest since Dec 2025: figures
DateCustomer success
2025-12-14375
2025-12-21384
2025-12-28380
2026-01-04380
2026-01-11400
2026-01-18381
2026-01-25401
2026-02-01409
2026-02-08407
2026-02-15406
2026-02-22396
2026-03-01384
2026-03-08390
2026-03-15399
2026-03-22414
2026-03-29424
2026-05-10450
2026-05-17462
2026-05-24466
2026-05-31469
2026-06-07461
2026-06-14458
2026-06-21451
2026-06-28436
2026-07-05432
2026-07-12428
2026-07-19427
2026-07-26424
2026-08-02402
2026-08-09398
2026-08-23388
2026-08-30389
2026-09-13382
2026-09-20365
2026-09-27359
2026-10-04359
2026-10-11347
2026-10-18332
2026-10-25323
2026-11-01323

Source: Työmarkkinadata, open roles at tech companies, weekly, Dec 2025 to Nov 2026tyomarkkinadata.fi

Download image: Open customer success roles are at their lowest since Dec 2025

Canada leads in AI job ads and is rising fastest

19.9% of job ads in Canada

Canada leads in AI job ads and is rising fastest: figures
DateCanadaIrelandThe UKThe USAustraliaGermanyItalyFranceThe Netherlands
2019-01-011.8%4%2.1%1.7%2.2%2%2.2%2.4%1.8%
2019-02-011.7%3.9%2.1%1.8%2.1%2%2.1%2.3%1.8%
2019-03-011.6%4%2.1%1.7%2.1%2.1%2.1%2.2%1.8%
2019-04-011.5%4%2%1.7%2.2%2.1%2%2.1%1.9%
2019-05-011.6%4.1%2%1.7%2.2%2.1%2.3%2.1%1.8%
2019-06-011.6%4.1%2%1.7%2.1%2.1%2.3%2.1%1.8%
2019-07-011.7%4.2%2.1%1.7%2.2%2%2.4%2.1%1.8%
2019-08-011.7%4.1%2%1.7%2.2%2%2.9%2.1%1.9%
2019-09-011.7%3.9%2%1.8%2.2%1.9%2.8%2.1%1.9%
2019-10-011.8%3.9%2%1.8%2.1%1.9%2.8%2.2%1.9%
2019-11-011.9%3.9%2.1%1.8%2.1%2%2.9%2.4%1.8%
2019-12-012.1%4.2%2.3%1.9%2.3%2%2.9%2.5%1.9%
2020-01-012.2%4.3%2.3%1.9%2.4%2%2.9%2.4%1.9%
2020-02-012.1%4.4%2.4%1.9%2.4%2%2.8%2.3%2%
2020-03-012.2%4.8%2.6%2%2.8%2%3%2.1%2.1%
2020-04-012.3%5.5%3.1%1.9%2.8%1.9%3.5%2.3%2.2%
2020-05-012.1%5.5%3%1.7%2.8%1.9%3.6%2.3%2.2%
2020-06-012%5.3%2.9%1.6%2.3%1.8%3.5%2.2%2.1%
2020-07-012%5%2.9%1.5%2.6%1.8%3.4%2.2%2%
2020-08-011.9%4.7%2.6%1.5%2.6%1.8%3.3%2.3%2%
2020-09-011.9%4.9%2.5%1.5%2.5%1.7%3.1%2.2%1.9%
2020-10-012.1%4.9%2.7%1.6%2.5%1.8%3.2%2.2%1.9%
2020-11-012.3%5.3%3%1.7%2.5%1.9%3.4%2.5%2.1%
2020-12-012.5%5.3%3.1%1.9%2.8%2%3.8%2.5%2.2%
2021-01-012.8%5.9%3.5%2%3%2.1%3.9%2.5%2.4%
2021-02-012.9%6.3%3.6%2.1%3%2.2%3.9%2.3%2.6%
2021-03-012.7%6.6%3.4%2.2%3.1%2.4%4.1%2.2%2.6%
2021-04-012.7%6.9%3%2.1%2.9%2.4%4.2%2.2%2.6%
2021-05-012.8%6.2%2.7%2.1%3%2.4%3.7%2.2%2.6%
2021-06-012.8%5.9%2.7%2.2%3.2%2.4%3.6%2.1%2.5%
2021-07-012.7%5.7%2.7%2.2%3.4%2.4%3.7%2%2.4%
2021-08-012.7%5.2%2.6%2.4%3.6%2.5%4.1%2%2.4%
2021-09-012.7%5.1%2.6%2.6%3.6%2.5%4%2%2.4%
2021-10-012.9%5.3%2.6%2.7%3.4%2.4%4%2.1%2.4%
2021-11-013%5.5%2.7%2.8%3.3%2.4%4%2.2%2.5%
2021-12-013.2%6%2.9%3%3.4%2.5%4.2%2.3%2.6%
2022-01-013.5%6.2%3.2%3.1%3.7%2.6%4.2%2.3%2.7%
2022-02-013.4%5.7%3.1%3.2%3.4%2.6%4.1%2.2%2.6%
2022-03-013.3%5.7%3.1%3.2%3.4%2.6%4%2.1%2.6%
2022-04-013.2%5.1%3%3.2%3.4%2.6%4.1%2.1%2.5%
2022-05-013.1%5.2%2.9%3.2%3.4%2.6%4%2%2.5%
2022-06-013%5.2%2.7%3%3.1%2.7%3.8%2%2.5%
2022-07-013%5.2%2.6%2.9%3.2%2.6%3.8%1.9%2.4%
2022-08-012.8%5%2.5%2.7%3.1%2.5%3.6%1.9%2.5%
2022-09-012.5%4.8%2.4%2.6%3%2.5%3.4%1.8%2.4%
2022-10-012.4%4.6%2.3%2.4%2.7%2.4%3.5%1.8%2.3%
2022-11-012.3%4.3%2.3%2.3%2.6%2.3%3.3%1.9%2.3%
2022-12-012.2%4%2.2%2.2%2.5%2.3%3%1.8%2.2%
2023-01-012.2%3.7%2%2.2%2.4%2.2%2.8%1.8%2.1%
2023-02-012.1%3.4%2%2.1%2.3%2.3%2.6%1.7%2.1%
2023-03-012.1%3.4%2%1.9%2.6%2.4%2.6%1.7%2%
2023-04-011.9%3.4%1.9%1.8%2.5%2.3%2.4%1.7%2%
2023-05-011.9%3.3%1.8%1.8%2.4%2.1%2.4%1.7%1.9%
2023-06-011.8%3.4%1.7%1.7%2.3%2.1%2.3%1.6%1.8%
2023-07-011.9%3.8%1.8%1.7%2.4%2.1%2.3%1.6%1.9%
2023-08-011.9%3.8%1.8%1.7%2.5%2.1%2.4%1.6%1.9%
2023-09-012%3.7%1.8%1.8%2.3%2.1%2.4%1.6%1.8%
2023-10-012.1%3.8%1.8%1.8%2.2%2.1%2.4%1.8%1.9%
2023-11-012.2%3.8%1.9%1.9%2.1%2.1%2.4%2%2%
2023-12-012.4%4.1%2.1%1.9%2.3%2.1%2.4%2%2%
2024-01-012.5%4.3%2.2%2%2.4%2.3%2.4%2%2%
2024-02-012.5%4.2%2.3%2.1%2.3%2.3%2.4%2%2%
2024-03-012.5%4.3%2.3%2.1%2.4%2.3%2.3%2%2%
2024-04-012.6%4.6%2.3%2%2.4%2.2%2.4%2%2%
2024-05-012.7%4.5%2.4%2.1%2.4%2.2%2.3%2.1%2%
2024-06-012.8%4.6%2.4%2.2%2.4%2.2%2.4%2.1%1.9%
2024-07-013%5.5%2.6%2.2%2.4%2.3%2.6%2.1%2%
2024-08-013.1%5.7%2.6%2.3%2.5%2.4%2.9%2.1%2%
2024-09-013.2%5.5%2.7%2.4%2.6%2.3%2.8%2.1%1.9%
2024-10-013.3%5.7%2.8%2.5%2.5%2.3%2.9%2.2%2%
2024-11-013.4%6%3%2.6%2.8%2.3%2.9%2.4%2%
2024-12-013.5%6.5%3.2%2.7%2.8%2.4%2.8%2.3%2%
2025-01-013.7%6.6%3.4%2.7%3%2.5%2.8%2.3%2.1%
2025-02-013.8%6.5%3.5%2.8%3.1%2.6%2.8%2.3%2.1%
2025-03-013.9%6.8%3.6%2.8%3.5%2.7%3%2.5%2.2%
2025-04-014.1%7.3%4%2.8%3.5%2.8%3%2.6%2.2%
2025-05-014.3%7.6%4%2.8%3.6%2.9%3%2.5%2.2%
2025-06-014.6%8.2%4.4%3%4.1%3.1%3.2%2.6%2.3%
2025-07-014.9%8.9%4.5%3.2%4.7%3.2%3.3%2.7%2.3%
2025-08-015.2%9.5%4.9%3.4%4.8%3.6%3.6%2.6%2.3%
2025-09-015.6%9.5%4.9%3.6%4.8%3.6%3.4%2.6%2.3%
2025-10-016.2%10.6%5.5%3.9%5.1%3.6%3.3%3%2.3%
2025-11-017.3%11.3%5.9%4.2%5.4%3.7%3.5%3.3%2.5%
2025-12-019.3%12.2%6.7%4.4%5.8%3.9%3.7%3.5%2.6%
2026-01-0111.8%12.2%7%4.6%5.9%4.2%3.8%3.4%2.7%
2026-02-0113.3%11.8%7.2%5%5.9%4.4%3.5%3.3%2.8%
2026-03-0114.6%11.8%7.6%5.3%6.4%4.6%3.7%3.7%3%
2026-04-0116.2%13%8.3%5.5%6.9%4.9%4.2%4.1%3.1%
2026-05-0117.1%13.8%8.9%5.8%7%5.3%4.6%4.2%3.1%
2026-06-0117.6%14.3%9.3%5.9%7.4%5.3%4.4%4%3.2%
2026-07-0118.2%14.7%9.5%6.3%7.7%5.6%4.6%4%3.4%
2026-08-0118.5%15.3%9.7%6.7%7.6%5.8%5.2%4.1%3.5%
2026-09-0118.5%15.1%9.9%7.3%7.3%5.8%4.9%4.3%3.6%
2026-10-0119.9%15.2%10.2%7.6%7.2%6.2%5%4.9%3.6%

Source: Työmarkkinadata, share of job ads mentioning AI by country, monthly average since Jan 2019, data through Oct 2026tyomarkkinadata.fi

Download image: Canada leads in AI job ads and is rising fastest

Open roles at tech companies have turned downward

14,853 open roles

Open roles at tech companies have turned downward: figures
DateOpen roles at tech companies
2025-12-1412,352
2025-12-2112,429
2025-12-2812,320
2026-01-0412,211
2026-01-1112,452
2026-01-1812,801
2026-01-2513,084
2026-02-0113,400
2026-02-0813,591
2026-02-1513,840
2026-02-2213,747
2026-03-0113,714
2026-03-0813,903
2026-03-1513,904
2026-03-2214,076
2026-03-2914,261
2026-05-1014,291
2026-05-1714,225
2026-05-2414,228
2026-05-3114,197
2026-06-0714,309
2026-06-1414,502
2026-06-2114,360
2026-06-2814,393
2026-07-0514,378
2026-07-1214,130
2026-07-1914,268
2026-07-2614,653
2026-08-0214,662
2026-08-0914,781
2026-08-2314,978
2026-08-3015,396
2026-09-1315,119
2026-09-2014,952
2026-09-2715,053
2026-10-0415,094
2026-10-1115,140
2026-10-1815,148
2026-10-2514,893
2026-11-0114,853

Source: Työmarkkinadata, open roles at tech companies, weekly, Dec 2025 to Nov 2026tyomarkkinadata.fi

Download image: Open roles at tech companies have turned downward

Method and sources

Latest figures November 1, 2026

  • Job pages of tech and growth companies: open roles per week by job family. It shows hiring at venture-backed companies, not the whole job market.
  • Tech hiring posts every month since 2011.
  • Share of job ads mentioning AI by country, monthly average since 2019. The share is a percentage of all of the country's ads.
  • Työmarkkinadata's own collection: open tech job ads from dozens of international recruitment systems. A skill's share is the percentage of ads that mention it.
  • Job vacancy rate: open vacancies as a percentage of all jobs, quarterly.

How we collect and count our own figures

See the full history and the hidden jobs

Pro shows postings back to May 2025 and companies hiring without a public posting, and tracks unlimited regions, companies and skills with email alerts. 14 days free, no card.

The global job market, November 2026 | Työmarkkinadata